Assessment of Historic and Future Trends of Extreme Weather in Texas, 1900-2036
Texas A&M University
Report by the Office of the Texas State Climatologist
Update 2024
(Link to full report)
(Commentary by Editor MeltOn)
Large thanks to State Climatologist John Nielsen-Gammon and his team. Texas is a big place and this report was a lot of work. The report contains the usual bad news we have all come to know and love over the years: temperatures, extreme weather, sea level rise and extreme precipitation will all continue to increase, while cold weather events will continue to decrease with a caveat that the 2021 snowmageddon was “extremely rare.” The report did not comment on the unprecedented ice storm across the Austin region and much of the rest of Texas last year. There are a couple details that I would like to share about the Austin region that differ from this report, and an important caveat about climate reports and climate science in general, that creates understatements in findings and reporting.
(Report quotes in green.)
“Texas precipitation has increased by 15% or more in parts of eastern Texas.” In Austin, the 1991 to 2020 30-year average rainfall at Camp Mabry is 36.25 inches. In 1970 and 1980 it was 31.60 and 31.59 inches. This also an increase of 15 percent.
A little know issue with weather data however, is that the way the National Oceanic and Atmospheric Administration (NOAA) evaluates the data creates substantial understatement. This conundrum is called the non-stationarity bias, where for normal statistical analysis to be valid, the data set must be stationary, stable, or not moving. With warming today, the data are moving. The results of statistical analyses using rainfall data have been analyzed to understand this non-stationarity bias and results can be as much as 60 percent understated. This is why we need to be looking at shorter time averages for weather data in our rapidly changing climate. Even though natural variation makes the average less accurate, shorter average calculations are likely much more accurate than the 60 percent understatement of tradition statistics and a 30-year average.
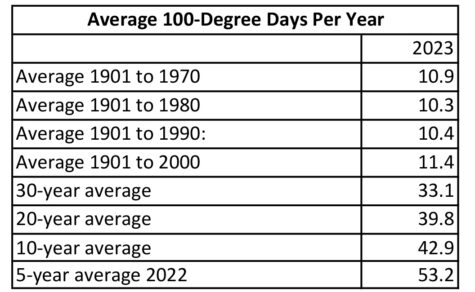
“The number of 100-degree days at typical stations is expected to quadruple by 2036 compared to the 1970s and 1980s.” This is the 30-year average. In a rapidly changing climate this long time period for reporting the warming temperature can really mess up public perception. In Austin, the 1900 to 1990 average number of 100 degree days was 10.5 per year. The 10-year average in 2023 was 42.9 days per year, or about a quadrupling already, not in 2036.