The details of the temperature record are a lot more extreme than the National Weather Service averages reveal. Their current January average for Camp Mabry is 2.1 degrees above normal, but it’s nearly 5 degrees warmer than the 1980 average. Is this just the normal chaos of weather?
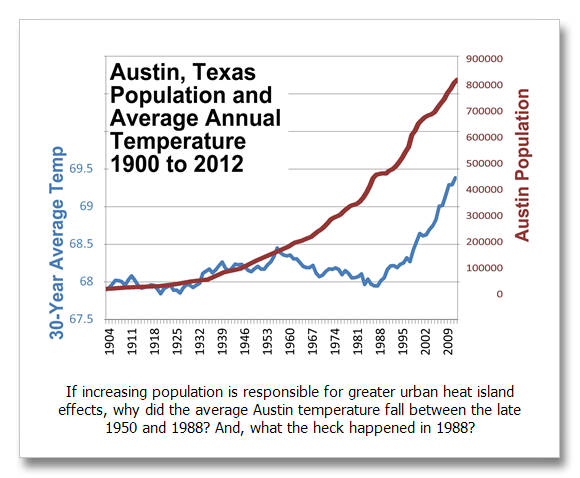
The annual average Austin temperature has increased 1.5 degrees in the last 25 years. It doesn’t sound like much and it is not, unless it is taken into perspective. The previous 90 years in Austin saw the average annual temperature change only a bit more than 0.5 degrees. The biggest change was between 1925 and 1955. So in the last 25 years, we have had three times that amount of change. The average annual temperature however has a lot of noise in it and it doesn’t tell us as much as the high and low temperatures. This noise is the chaos of weather: natural variation, natural cycles, normal swings in temperature, whatever you wish to call it.
It is the extremes that matter to living things out of doors. Warmth in January means things sprout and bud out; bugs hatch. Then weather chaos returns and freezes them to death. Birds and other animals go hungry, their young starve, plants are stressed (or dead). In the summer drought is made worse by hotter temperatures because evaporation is a lot more with a little more warmth. Evaporation does not have a one to one relationship with temperature. A little more warmth means a lot more evaporation.
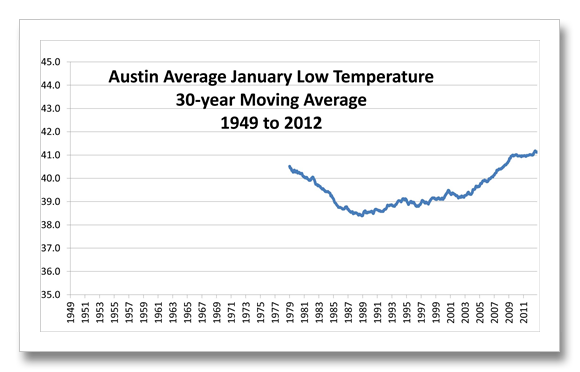
Surprisingly, there is a lot more change hidden in the “normal” temperature we hear on the weathercast every night. The National Weather Service changes the average temperature every ten years based on the previous 30-years of temperature records. Their reasoning being accuracy of weather records because of natural climate variation. The 30-year time frame is based on statistical accuracy, anything less and there is too much chaos and the average is not accurate. The agriculture industry needs to know these things so they can plan planting dates, budget for irrigation; know when to spray insecticides and do other things that a little change in the average weather can influence.
Beginning in the 1980s we began to see the impacts of climate warming separate from natural cycles. We know now that this has been because of increasing greenhouse gases. We didn’t know for sure then, climate scientists said it would be twenty years before we knew for sure. More than twenty years later we know for sure and the Weather Service has been changing the “normals” ever since. In these warming times it seems the temperature is “far above normal” more often than not, even with the changes to the averages every ten years. The results are that it is even warmer than the “average normal temperature” tells us.
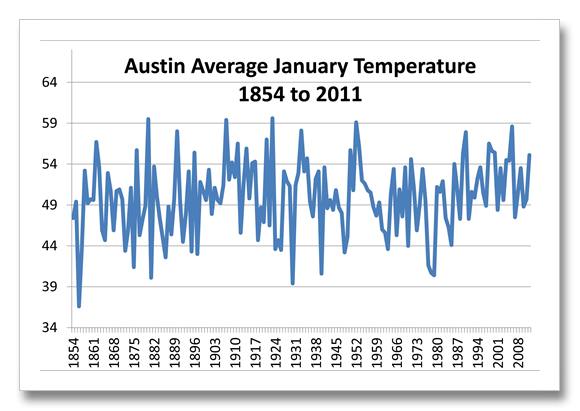
In January (2013) our average temperature was 53.6 degrees. this was the 34th warmest since 1854 when record keeping began. This is 2.1 degrees above the National Weather Service’s latest 2010 normal 30-year temperature average, but it is 4.9 degrees above the 30-year normals prepared in 1990. In 2010 Austin’s average January temperature was 51.5; in 2000 it was 50.1 and in 1990 it was 48.7. And the 30-year average continues to change even more rapidly. In the last three years the 30-year January average has increased another 0.3 degrees. This is nearly two-thirds as much as the entire change for most of the 20thcentury—in just three years. (1)
Abrupt climate changes have happened naturally about 23 times in the last 100,000 years. We find direct evidence in layers of ice preserved in Greenland in the deep freeze that (formerly) never melted. (See Ice Sheets Behaving Badly and Greenland Melts for the rest of the story, fouled up again by the media echo-chamber.) These “abrupt climate changes” often happen when natural forces were “pushing” climate hard. These abrupt changes were on the order of 9 to 14 degrees or more Fahrenheit on average across the planet and 18 to 27 degrees or more across northern latitudes. (2) Over land in the mid-latitudes the change in temperature change was likely as much as twice the global average. But these were natural changes. Today, 7 billion people are changing our CO2 concentrations an unbelievable 14,000 times faster than anything normal in the last 610,000 years. (4)
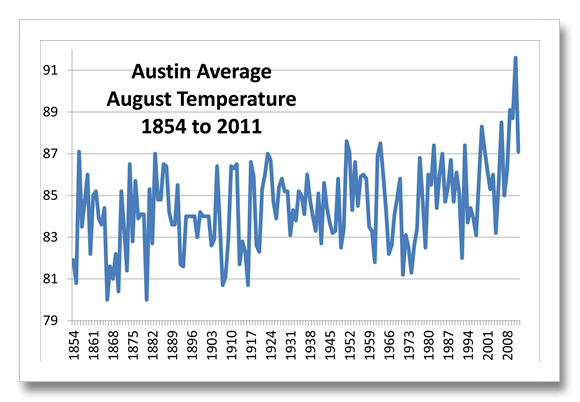
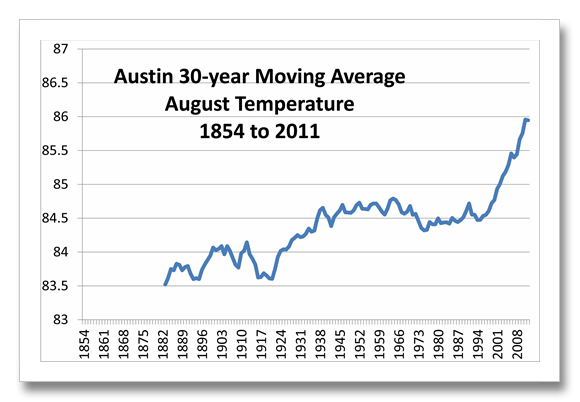
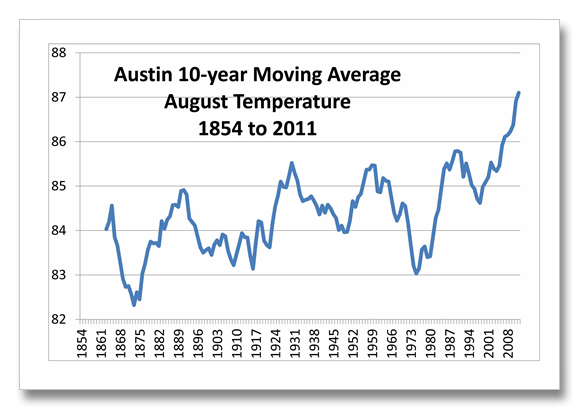
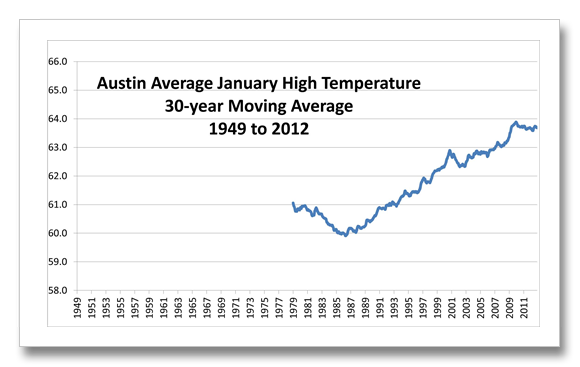
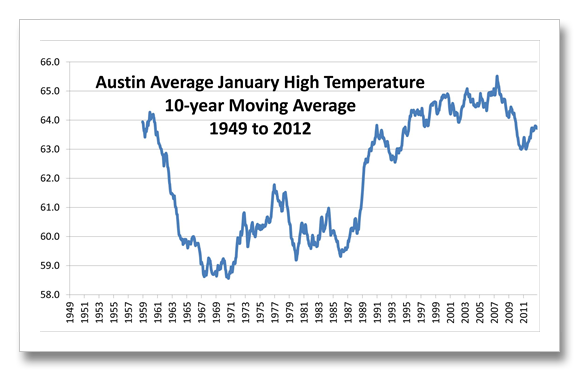
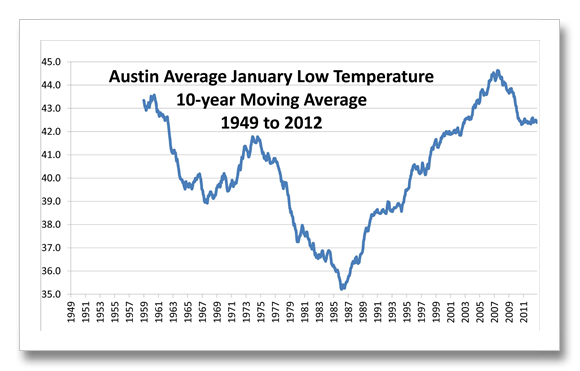
According to National Weather Service temperature records, the average August temperature in Austin has increased between almost 5 degrees in the last 20 years. The average January high temperature has increased 6 degrees in the last 10 years and the average January low temperature has increased 9 degrees in the last 10 years.
So, when the evening weathercaster tells the low last night was 10 degrees warmer than normal, was it 10 degrees warmer, or 19 degrees warmer?
Let’s go back to the January average increasing 0.3 degrees in the last three years. All of the sudden the average temperature is shooting skyward. We have been warmed that this would happen. To get such a long term average to move so dramatically over a short period of time, there must be dramatic changes in temperature. This is what is happening and the astonishing new U.S. annual temperature record in 2012 that is a full degree warmer than the previous record (1998) is an example. (5) It’s not happening everywhere every year, and there is a lot of chaos or natural variability in the system, but it is happening and it is happening a lot faster than it was happening just ten or twenty years ago.
Those abrupt climate changes that we see in the layers of the Greenland Ice Sheet often happen in a century or less, sometimes decades and it seems the bigger the jump, the faster it happens. It was 18,000 years ago when our climate changed nine degrees on average across the planet, probably 18 degrees over land, in just three years. It stayed that way for over 1,000 years. Climate scientists have named this astonishing abrupt climate change the “Younger Dryas.” It happened as we were moving out of the last ice age when natural forces were “pushing” climate as hard as they could. But let me repeat: today, 7 billion people are “pushing” our climate somewhere around 10,000 times harder than anything natural in the last 610,000 years. (6)
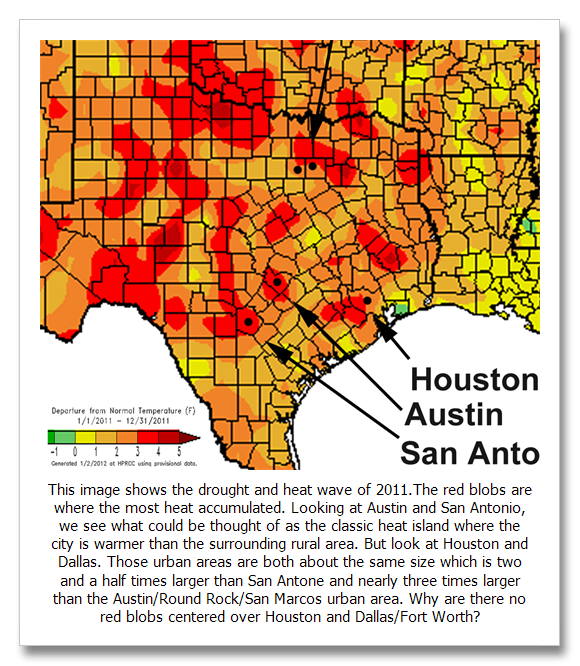
Traditional meteorology procedures are no longer valid in our rapidly changing climate. We need to understand how our planet’s climate has changed abruptly in the past and the relationship of past changes in greenhouse gases to changes we are creating today. Let me leave you with two graphics related to the urban heat island to help understand one of the big myths that challenges what I have said above. The “urban heat island” is what happens in an urban area because all the concrete, asphalt and rooftops absorb more heat than trees or agricultural uses in rural areas. It is responsible for some warming in Austin as it is any urban area, but how much warming is it responsible for?
Different air masses, with their differing winds, clouds, rain, snow and air mass depths create differing amounts of urban heat island effect. Calibrating urban thermometers for climate change evaluation is a daily and even hourly task. These two graphics will show you what the perceived heat island controversy is all about.
Is it abrupt climate change? We’ll know in a few years. Science is slow, but this is not, er, something that they will let go on for twenty years.
Links:
January 3, 2013 — Ice Sheets Behaving Badly
https://climatediscovery.org/ice-sheets-behaving-badly/
August 8, 2012 — Greenland Melt’s: It’s Not About the Past
https://climatediscovery.org/greenland-melts-its-not-about-the-past/
References:
(1) Temperature evaluation: 30-year annual normals are from the National Weather Service… (See the graphics in this section.)
http://www.srh.noaa.gov/images/ewx/aus/attmontemp.pdf
Daily highs and lows from the National Climatic Data Center —
http://www.infochimps.com/datasets/austin-daily-weather-extracted-from-national-climate-data-center
(2) Abrupt climate change 23 times in the last 100,000 years… Steffensen et al., High-Resolution Greenland Ice Core Data Show Abrupt Climate Change Happens in a Few Years Science Express, June 12, 2008. See the abstract.
Abstract: http://www.sciencemag.org/content/321/5889/680.abstract
Paper: http://learn.enspac.ruc.dk/sites/default/files/ClimatePhD/documents/Steffensen%20et%20al.pdf
(3) Warming over land is twice or more the global average because of cool ocean waters…
Ganguly et al., Higher trends but larger uncertainty and geographic variability in 21st century temperature and heat waves, PNAS, September 2009. See Figure 2. http://www.pnas.org/content/106/37/15555.full
(4) CO2 is changing 14,000 times faster than the long-term average for the last 610,000 thousand years… Zeebe and Caldeira, Close mass balance of long-term carbon fluxes from ice-core CO2 and ocean chemistry records, Nature Geoscience, Advance Online Publication, April 27, 2008. http://content.imamu.edu.sa/Scholars/it/net/zeebe_caldeira_2008.pdf
14,000 time is “hidden” in the geek–speak in Nature Geoscience paper. See the interview with Zeebe, “Human warming hobbles ancient climate cycle“ Reuters, April 27, 2008, eight paragraph. http://www.reuters.com/article/2008/04/27/us-climate-warming-idUSN2541737720080427?pageNumber=2&virtualBrandChannel=0&sp=true
(5) The U.S. annual temperature record for 2012 beat the previous record (1998) by a full degree… NOAA, National Climatic Data Center, National Overview, first paragraph. http://www.ncdc.noaa.gov/sotc/national/2012/13
(6) The Younger Dryas: Nine Degrees in just three years… Zeebe and Caldeira, Close mass balance of long-term carbon fluxes from ice-core CO2 and ocean chemistry records, Nature Geoscience, Advance Online Publication, April 27, 2008, first paragraph. http://content.imamu.edu.sa/Scholars/it/net/zeebe_caldeira_2008.pdf
(7) Urban heat island and night light calibration of urban temperature data… NASA, Goddard Institute for Space Studies, GISS Surface Temperature Analysis (GISTEMP) (accessed january31, 2013) See Current Analysis Method.
http://data.giss.nasa.gov/gistemp/
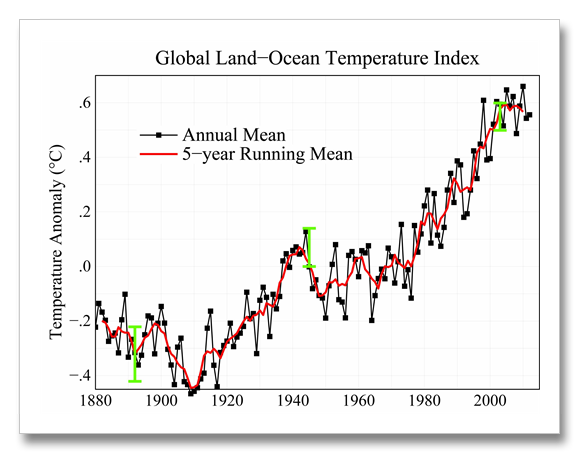
The following graphics are from the Austin temperature record. Monthly: Austin, 1854 to 2011, daily: Camp Mabry, 1949 to 2012.
All of these graphs show a dip, or flattening of the temperature rise between 1940 and the late 1970s. This is widely believed to have been from aerosol pollution during WWII, the industrial war machine and post-war industrial expansion. It came to a fairly abrupt end in the 1970s and early 1980s with the passage of the Clean Air Act. Aerosol pollution, largely nitrous oxides and sulfur dioxides (NOx and SOx) are cooling pollutants and they are short lived, lasting only days to a few years in the atmosphere. They were significantly cleaned up in developed nations post 1970 and when they were, warming resumed.

