The last five years have seen 30 to 60 percent more rain in the Central Texas Highland Lakes watershed than in the worst five years of the drought of the 1950s, and the latest National Weather Service 30-year rainfall averages for the watershed have increased seven to twenty percent. Austin is up nine percent.
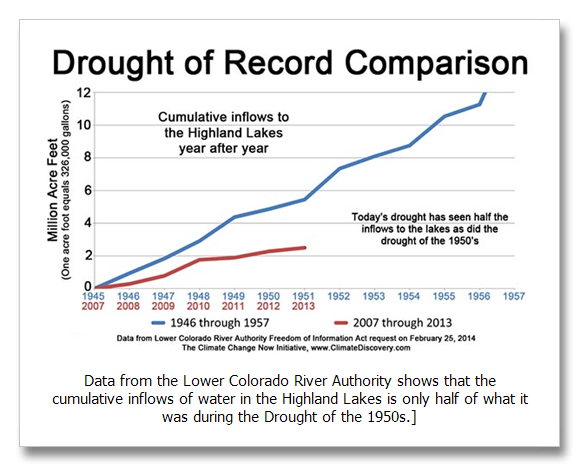
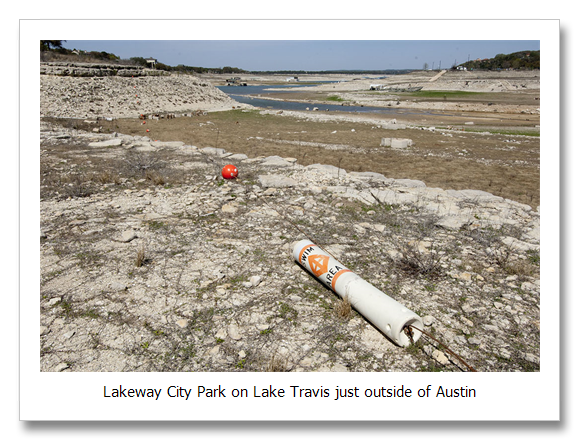
Opposite to what one would think, total inflows to the Highland Lakes during our current drought are only half of what they were during our state’s counterpart to the Dust Bowl—the drought of the 1950s. And counter intuitively, with far less water coming into the system, the lakes have yet to set new low lake level records.
The reasons for this science fiction-like change could be attributable to many things like population growth for example. But once the numbers are evaluated, the most likely explanations are none other than what climate scientists have been warning us about for over twenty years.
Our regulatory authorities were set up to deal with situations where a new drought more extreme than the old worst drought on the record would trigger policy changes to address the threat of less water availability. But because our climate has changed, this new drought is not like the old.
We have had more rain than during our worst drought ever recorded (the drought of record) but less water is flowing into the lakes.
The Lower Colorado River Authority (LCRA) drought of record determination criteria compares a current drought to total cumulative inflows for the drought of record. As an example, if the lakes had 200,000 acre feet flowing into them in them in 2008 and 150,000 acre feet in 2009 the cumulative inflow would be 350,000 acre feet. (An acre foot is one acre covered with one foot of water.)
To be a new drought of record, the cumulative inflows must be five percent less than the worst of the 1950s.
LCRA has two more criteria that must be met to declare a new drought of record. One is that the drought comparison for the new drought starts the last time the lakes were full and must be at least two years in duration. The other is that the current total Highland Lakes volume must be below 600,000 acre feet.
When the cumulative inflows to the Highland Lakes for the last six years since the last time the lakes were full are compared to the drought of the 1950s it is clear that this drought is far more extreme than Texas’ drought of record. Yet, the concept persists that this drought has yet to equal the drought of record.
Why has LCRA not declared a new drought of record? This is because LCRA’s drought of record criteria says that new low lake level records must be set and the lakes have yet to do this. So if inflows are only half of those during the worst drought Texas has recorded, why have the lakes not set new record low levels? The answer is because the criteria are based on our old climate. The details are numerous and one final detail about population growth and historic water use will really surprise you.
Across the watershed the temperature has increased about one degree F. (1) Because a little warming creates a lot more evaporation and the most evaporation comes from plants and soils not the lake’s surface, it is entirely plausible that warming has reduced the amount of runoff flowing into the lakes.
Warmer temperatures also cause plants to use more water. Spring is coming earlier (2) and a longer warm season causes more water use as well as warmer winters allow some plants to keep growing which also uses more water. These relationships also make it plausible that less water is coming from soils with more rain and warmer temperatures, thus reducing spring flows into the Highland Lakes.
Changes in the way we get our rain contribute too. The latest National Climate Assessment says that the heaviest one percent of rain events are happening 16 percent more in Texas. (3) Consequently, it is quite likely that dry spells between storms are getting longer. There is no data for this in our region yet, but in the U.S. Southeast, research has shown that droughts and floods both have doubled in the last 30 years. (4)
What this means is that longer dry intervals between storms allow deeper drying of soils. So when it does rain, more soaks in and less runs off.
It might seem that there is another easy explanation of why the Highland Lake levels are so low considering that rainfall has increased; the Austin region population has skyrocketed. Since the 1950s Austin’s population has increased by almost ten times. Water use per person has also increased over time as well.
But, counter intuitively once again, this is not the answer. This is the big surprise that is reveled by data from LCRA.
From 2008 through 2011, total Highland Lakes water releases are within one-tenth of one percent of being the same as releases during the worst four years of the drought of record (1951 through 1954). This does not include 2012 and 2013 when LCRA stopped releasing water for agriculture downstream.
Astonishingly, and as dumbfounding as it may seem, today’s total releases from the Highland Lakes are almost exactly the same as they were 60 years ago. How could this be possible with the Austin region population boom? The answer is hydroelectric generation.
Rural electrification was one of the main reasons the Highland Lakes were built. LCRA began to build gas and coal fired power plants to meet the increasing electricity demand in the 1960s and as these facilities came on line LCRA began to curtail hydroelectric generation releases. By the 1980s, LCRA no longer generated electricity without that water first being released for municipal, industrial or agricultural reasons.
Getting the data that shows this however has not been possible. LCRA says they did not keep separate records for water released solely for hydroelectric generation. But there is other evidence.
The LCRA 2010 Lake Recreation Impact Study tells us: “LCRA’s reduced hydropower generation has caused the average monthly level of Lakes Buchanan and Travis to rise by nearly twelve feet.” LCRA’s Hydromet lake volume calculator says this is equal to 417,000 acre feet per year. This volume of water is more than twice what the City of Austin uses every year and it is completely disregarded by LCRA’s drought of record evaluation criteria.
Because the lakes contain about 417,000 more acre feet of water per year today than they did in the 1950s, it is obvious why we have not set any new record low lake levels.
LCRA, has yet to acknowledge this unfair comparison and declare a new drought of record even though five out of the last six years are included in the lowest six years of inflows on record. The worst year in the 1950s ranked only tenth lowest.
There are other considerations to be made in a thorough evaluation of how our changed climate has so drastically altered our previously known world of water. More reservoirs upstream capture more water upstream, but those reservoirs are only nine percent full today.
Water wells for agriculture irrigation have proliferated since the drought of the 1950s too, but these wells generally draw from fossil water far beneath the surface and have relatively small impacts on springs and stream flows. The again, springs flows only make up a small percentage of the floodwater flows that typically fill the lakes.
More folks live along the lakes and get their water directly from the lakes, but this volume too (estimated at 5,000 acre feet per year by LCRA) is trifling when compared to the big picture. Rangeland changes may have had an impact, but evidence suggests that the changes have not been substantial since the 1950s.
But this does not change the fact that the cumulative total of water flowing into the lakes beginning in 2008 has only been half of what it was during the worst drought of record. Nor does tell us why LCRA does not recognize 417,000 extra acre feet of water in the lakes every year because of the cessation of sole purpose hydroelectric generation.
What this all means is that, quite likely, today’s drought is not only worse than the drought of record, it is far worse than the drought of record.
What climate scientists are now saying is that the American West, including Central Texas, is entering a new era that rivals megadroughts of the ancient past that were 10 to 100 times worse than the Dust Bowl. (4)
The researchers, from Lamont Doherty Earth Observatory of Columbia University, and NASA’s Goddard Institute for Space Studies say their modeling shows megadrought to arrive by 2020. To underscore the imminent arrival of our new climate the principal investigator for this research told me in an email correspondence that what we know of as normal drought today will be superimposed on top of the megadrought dryness baseline in their research.
Given the extremeness of our current drought and given the long history of our understanding of what will happen to our planet with global warming and how much faster it will happen if we delay addressing climate pollution, it certainly could be said that we are seeing the beginning of megadrought today.
So even though the Highland Lakes today have only seen half of the water flowing into them than the drought of record in the 1950s, current regional water planning efforts make no mention of anything more extreme than the drought of record. Water planning efforts across the State are just as myopic.
We absolutely must take into consideration the latest climate science, the latest weather data and the obvious history of our past water use. It is very likely that we have already begun the transition to a radically different climate, but local and state water policy continues to be based upon knowledge and politics from the 20th century.
Climate scientists warned us twenty years ago that delay would cause climate change to happen faster and with greater extremes. Now they are warning us with renewed vigor that more delay will make our task disproportionately harder still.
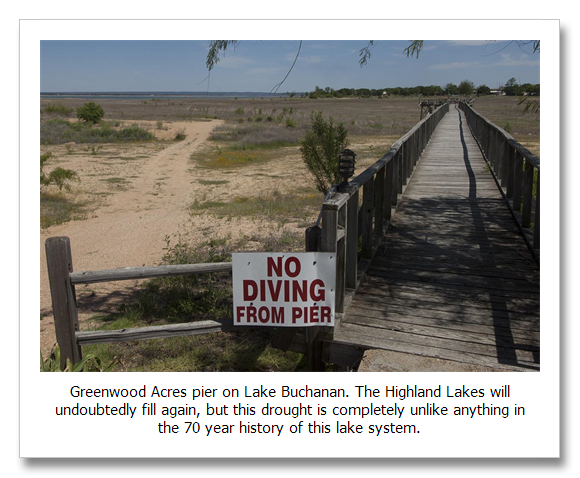
The lakes will undoubtedly fill again (and again), but understand; they were 90 percent full just 17 months prior to the dry spike of 2011 when they fell to 37 percent of capacity. More surprises will surely arrive as climate change increases in intensity.
References:
1) The watershed has warmed about a degree…
Third National Climate Assessment, 2014, Figure 2.7 Observed U.S. Temperature Change.
http://nca2014.globalchange.gov/report/our-changing-climate/recent-us-temperature-trends
2) Spring is coming earlier… Average temperature is not the best indicator of a changing climate and even less indicative of the total amount of increase in warmth. In the western U.S., spring is arriving up to 30 days earlier based on first melt records. Research from Scripps Institution of Oceanography and the U.S. Geological Survey tells us “Many streams have yielded CT advances of 10–30 days over the 1948–2000 observational period.” CT is “The timing of this snowmelt discharge, as indicated by the timing of the center of mass of flow, or center time”
Stewart et al., Changes in snowmelt runoff timing on western North America under a Business As Usual climate change scenario, Climatic Change, 62, 217-232, 2004, page 223, final paragraph.
http://meteora.ucsd.edu/cap/pdffiles/stewart_clch.pdf
USDA Hardiness Zone Maps show a five degree increase in minimum annual extreme temperatures, mostly since 1990.
Melton, USDA Hardiness Zones Have Shifted North, Climate Discovery, April 20, 2012.
https://climatediscovery.org/hardiness-zones-have-shifted-north-climate-change-is-here/
3) Heaviest one percent of rain events are happening 16 percent more frequently…
Third National Climate Assessment, 2014, Figure 2.18 Observed Change in Very Heavy Precipitation.
http://nca2014.globalchange.gov/report/our-changing-climate/heavy-downpours-increasing
4) Droughts and floods have doubled in the last 30 years in the U.S. Southeast…
Li, et. al., Changes to the North Atlantic Subtropical High and Its Role in the Intensification of Summer Rainfall Variability in the Southeastern United States, Journal of Climate, October 2010, first paragraph.
http://journals.ametsoc.org/doi/pdf/10.1175/2010JCLI3829.1
Duke Press Release: http://www.nicholas.duke.edu/news/increasingly-variable-summer-rainfall-in-southeast-linked-to-climate-change
5) Megadrought may begin by 2020 that is 10 to 100 times more extreme than the Dust Bowl… Research from Lamont Doherty Earth Observatory of Columbia University, and NASA’s Goddard Institute for Space Studies tells us four megadroughts between 850 and 1500 A.D. lasted for up to two hundred years each with precipitation less than 25 percent of what we think of as normal today. The Dust Bowl lasted 10 years. These are the baseline conditions that are predicted to begin across the Western U.S. by 2020. What we know of as drought today will be superimposed on top of this megadrought dryness baseline. Seager et al., Projections of declining surface water availability for the southwestern United States, Nature Climate Change, December 2012, page 5, last paragraph.
http://www.ldeo.columbia.edu/res/div/ocp/pub/seager/Seager_etal_NCC2012.pdf
Abstract: http://www.nature.com/nclimate/journal/vaop/ncurrent/full/nclimate1787.html
Earth Institute press release: http://blogs.ei.columbia.edu/2012/12/23/smaller-colorado-river-projected-for-coming-decades-study-says/


