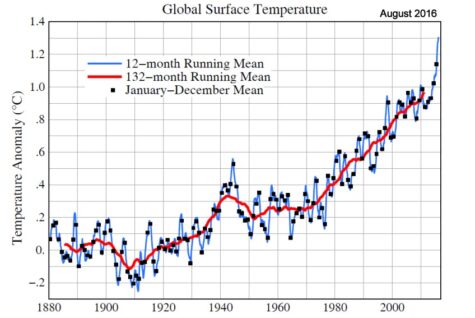
Hansen, Sato and Lo: new hockey stick.
Super Nino may have caused the temperature peak, but the chaos is weather too. The big question is, “how much will it cool off next year?” It may not be much. The way the extremes are increasing (and have you seen the recent jump in sea level rise) it is becoming obvious that we have likely crossed a threshold into the much more rapidly changing phase of climate change. Climate scientists warned us this would happen 20 years ago if we delayed action.
Hansen and his climate science coworkers have come up with a more elegant hockey stick. It shows a 12-month running average, so every month we can see how hot it is instead of waiting until after the end of the year to see the previous year’s temperature. The black squares are the annual average and mark individual years. The red line is the 132-month average.
Hansen and team also say they have a new paper on temperature that reduces the warming seen in 1940-1945. They say it is likely exaggerated because of poor data during WWII.
http://www.columbia.edu/~jeh1/mailings/2016/20160926_BetterGraph.pdf
