The State Climatologist is little different from most climate scientists. I have one thing to say about climate scientists and State Climatologists: They can not say what they see coming, only what their data tell them. The conservative nature of science demands that scientific proclamation be robustly supported by long term data. This makes it difficult to identify a fundamental shift in data until long after that fundamental shift has occurred. Like Climate scientists told us in the 1980s, that it would be 20 or 30 years before they had enough data to tell if climate change was real and if it was caused by man — we have the data now, it is real, it is caused by man and it started 20 or 30 years ago. This is only good scientific practice and I would not have it any other way. But we have a problem here with any number of ongoing extraordinary climate change impacts that are just not getting anyone’s attention. And we have a problem with these irreversible tipping points that are lurking, or even have already begun. Are we supposed to wait another 20 or 30 years to find out if we have irreversible changed our climate?
Right now I want to talk about Texas and this totally unprecedented drought and series of wildfires that have menaced this state for the last half dozen years. We beat the 100 degree day record by at least 30 percent this year. Statistically, this means something extraordinary has happened. Yet, few acknowledge anything more than La Nina and how we will get back to “normal” as soon as La Nina goes away. This statistical anomaly shows that we have seen a fundamentally shift in our weather pattern. For twenty years climate scientists have been warning us that this would happen. Now that it has happened, nobody noticed! There is much more to this story as I will tell.
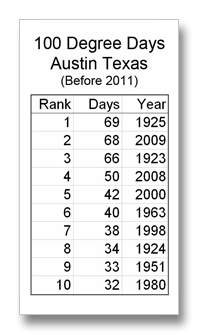
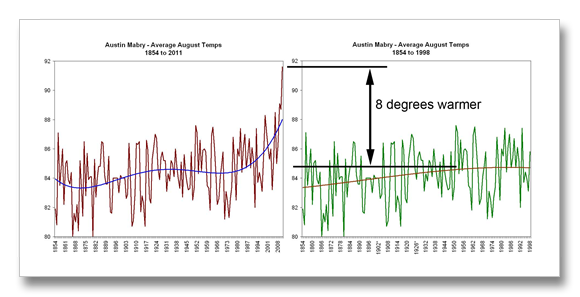
The “so-called” record number of 100 degree days for Austin, 69 set in 1925 and 66 set in 1923, are very likely in error. These years were certainly hot, but surrounding weather stations from Del Rio to Dallas come no where near these levels. Let me back up a little bit. About the turn of the 21st century, our climate began an abrupt change. This is evident in regional areas across the globe including both polar regions. The American West is warming at twice the rate of the global average. The Arctic is warming at 4 to 5 times the global average.
The unprecedented snowstorms in the U.S. Northeast and parts of Europe in the last two or three years, the tremendous winter in China three years ago are other regional scale changes of unprecedented nature that are far beyond the known records. Moscow’s heat wave last year was, as Weather Underground says, possibly a one in 15,000 year event. And what about the 100-year drought in the Amazon in 2005 and the following drought in 2010 that was four times worse than the 2005 drought — that killed two billion trees or more? There are so many more — this is what my entire platform is built upon – climate changes happening now… In reality though, these type of climate change induced events have no statistical analogy because they are not statistically a part of the historic data set.
The state climatologist calls this year an outlier because it was 21 days more than the previous record. What do scientists do with outliers? They discard them. They are called outliers for a reason. This reason is that they are untrustworthy for some reason. Either there were errors in the collection or measurement of the data, or something fundamental happened to create new unique conditions that are “fundamentally” different from the rest of the data. Either way – the outlier does not belong to the same data set so it is thrown out. The outlier is not used in calculations involving that data. Because of the fundamental difference between the outlier and the rest of the data, the outlier contaminates the original data set and makes the results of any analysis regarding that dataset invalid, or at least untrustworthy. So the outlier is discarded.
Texas is in one of those areas that is changing most rapidly. If we look at 100 degree days before the year 2000, and not include 1923 and 1925 in this evaluation, we see that the most 100 degree days we ever had before was 40. The 1923 and 1925 records were 65 and 73 percent greater than the 3rd ranked most extreme temperatures Texas has endured in the instrument record.
So if the State Climatologist says the 2011 record of 100 degree temps is an outlier, and the 21 days that the 2011 record exceeded the previous record of 69 is 30 percent greater than the previous record, why are the 1923 and 1925 records not outliers too? Prior to 2000, for 75 and 77 years, the 1923 and 1925 records were at least 66 and 73 percent greater than the third ranked record. This disparity is twice the difference that the State Climatologists says created an outlier in 2011.
For nearly 40 years, from 1925 to 1963, the top two records were double the
3rd ranked record. Then, it took almost another 40 years for that 1963 record to be broken. This is absolutely a sign that something is wrong with those records. Any scientists or statistician can tell that those two records are for some reason quite unreasonable. Do I give most scientists too much credit? Likely not. Could it be that meteorologists are not as proficient with statistics as they could be or is there another reason for this “mistake”? The 1923 and 1925 records should have been discarded decades, if not generations ago.
We have broken the 100 degree day record five times since 1998, including this year. In the 1990s we set one of the top ten records (That was the 1998 record); the 1980s we set one; the 70s – none; the 60s one; the 50s — only one. This year’s record is 125 percent great than what is most likely the true 100 degree day record for Austin — prior to Earth transitioning into this abrupt climate change period that began shortly before the year 2000.
More evidence casting doubt on the 1923 and 1925 records is that 1922, 1923, 1925 and 1926 are incomplete — they have missing data. These are the last years in the record to have missing data and there were no years for the previous 18 years that had missing data. Prior to 1903, years with missing data were much more common than after 1903 — except for that period 1922 to 1926. Something is wrong with those records.
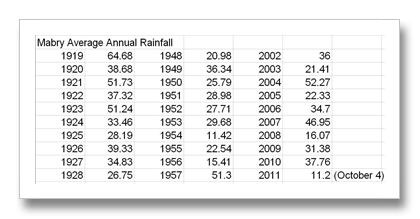
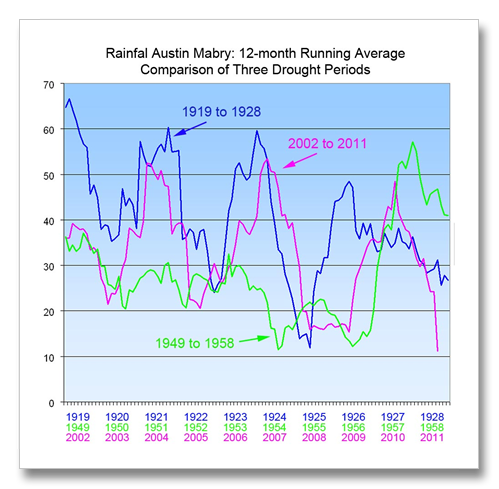
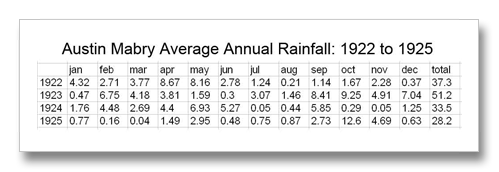
Beyond that entire period being questionable because of missing data, there are the rainfall records that do not appear to be extreme enough to have created the 1923 and 1925 100 degree day records. Rainfall is an excellent indicator of extreme heat. The hotter it is, the greater is the evaporation and the drier things get, allowing the temperature to become even hotter because moisture in the air prevents the temperature from going even higher. Looking at the chart “Mabry Average Annual Rainfall”, I have compared the rainfall records for three periods this century with extreme drought: 1919 though 1928, 1948 through1957 and 2002 through 2011.
Since last October, we have had 23 inch less rain than we are supposed to have. In other words, we have received a little over 11 inches of rain in the last 12 months. This has been the driest 12 month period ever recorded. The average rainfall in Austin is around 32.5 or 33.5 inches, depending on which 30-year record period one is looking at. Every ten years, the National Weather Service updates the average weather statistic data (temperature, rainfall, etc.) to reflect the most recent 30 year period. This is why the average annual rainfall differs slightly.
Rainfall makes a huge difference with summer temperatures. In 2008 we had 22 inches of rain in May, June and July. That summer we only experienced three days of 100 degree heat in Austin. The simple reason was that there was so much water in the ground, so many extra leaves on the trees and extra grass on the ground, so much water in our lakes and rivers, that the humidity stayed high almost all summer long. As a consequence we only had three 100 degree days that year.
To show how far off 1923 and 1925 are I have plotted the12-month running average rainfall for the three hottest/driest periods in the last 100 years. I used the 12-month running average for two reasons. The first is that an average smoothes out a lot of the chaos inherent in weather data. Using average numbers helps us to see trends and other things in data that mean something. It is simply difficult to see underlying information with wildly chaotic data. The other reason I used the 12-month running average is that we just broke the all time minimum rainfall record for a 12-month period. This was set in the great drought of the 1950s.
If 1923 and 1925 followed the normal laws of physics, and the 100 degree day records those years were valid, the rainfall during those periods would have been the lowest up until this year. But like data sometimes are, the results here are puzzling. The blue line in the plot shows rainfall during the 1919 to 1928 period. 1925 does show rainfall low enough to support extremely hot temperatures, but what happened in 1923? The average rainfall during 1923 was 51 inches. There is nothing exceptional about summer rainfall either. It was a little low, but July saw 150% of normal rainfall.
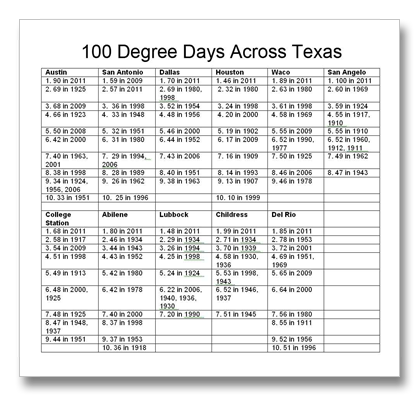
To summarize why the 1923 and 1925 records for 100 degree days are not valid: For 75 years, those two records were 67% and 73% beyond the 3rd ranked record. In the last 13 years, since our climate has started changing rapidly, the third ranked record has been surpassed five times. Of the top 10 records for 100 degree temperatures for nine of the major metro areas surrounding Austin, of the 90 records involved, only five were set in the 1920s–two of these were the 1923 and 1925 records in Austin. The 1920s records are full of missing data too. Finally, the State Climatologists says that 2011 is an outlier when it was only 30% greater than the previous record (the 1925 record of 69 days.) The 1969 record was 73% greater than the previous record.
Now for the excursion back to climate change reality: Beginning in 2090, I know this is a long way off, but the projection is sobering — we will see 90 to 120 days a year, on average, of 100 degree plus temperatures per year (USGCRP 2009). The Sonoran Desert Research Station, today, averages 87 days of 100 degree plus heat per year. Beginning in 2030 we will see average conditions very similar to Dust Bowl conditions across much of the nation (Dia 2011). In the next ten years in Central Texas, we will see three to five heat waves as hot as, or more extreme than the hottest period since 1950 (Diffenbaugh and Ashfaq 2010). Average conditions in Austin are 12 days of 100 degree weather per summer. For 150 years, up until the year 2000, the extremes were no more than 40 days per summer. This is double or triple (or more) of the average.
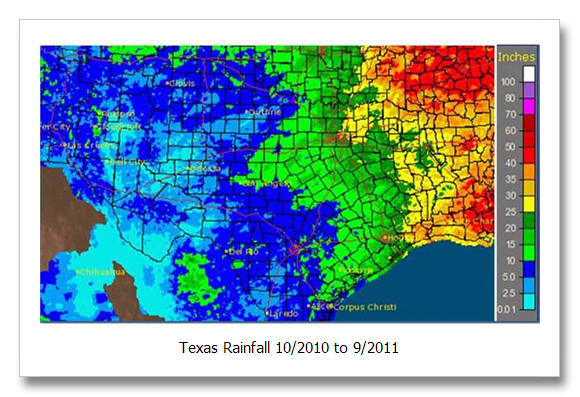
The 12-month period October 2010 to September 2011 saw only 11.2 inches of rain in Austin. this was an record not seen in history of record keeping. Across half (or more) of Texas, less than ten inches of rain fell during this period.
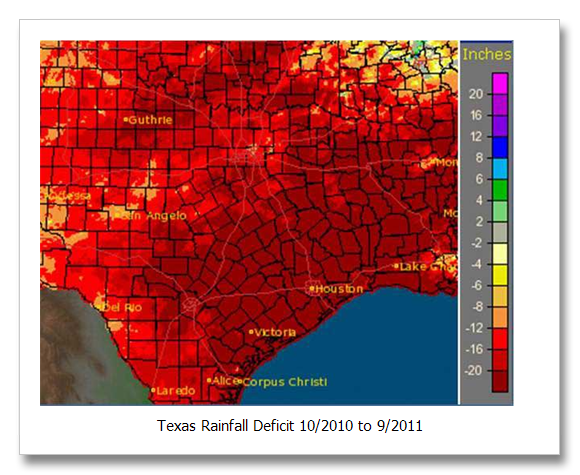
The next graphic is a lot more scary, but significantly less meaningful. Even though it less meaningful, it does show that about half of Texas is 20 inches of rain behind normal for the period October 2010 to September 2011. Regardless of how meaningful, being 20 inches behind is a huge thing if you are a plant or animal living outdoors. Conditions like this cause virtually all surface water to evaporate. The largest rivers in Texas have been reduced to a trickle. The Colorado River above Lake Buchanan stopped flowing. Ponds and tanks across agricultural lands statewide are dry or nearly so.
Will we run out of water in 2012? Lake Travis is at 38 percent of normal and it appears that we are going back into another moderate (at least) La Nina, meaning that we will likely repeat conditions very similar to last year.
State Climatologist John Nielsen-Gammon http://blog.chron.com/climateabyss/2011/08/texas-drought-a-fingerprint/
Dai, Drought under global warming – a review, Wiley Interdisciplinary Reviews – Climate Change, p 45-65, January-February 2011
Diffenbaugh and Ashfaq, Intensification of hot extremes in the United States, Geophysical Research Letters, July 2010.
Global Climate Change Impacts in the United States, A State of Knowledge Report from the U.S. Global Change Research Program, 2009, page 90

