The polar jet stream normally runs around the roof of the world like the Siberian express. It spins around the top of the world and keeps Arctic cold bottled up and has been called the “polar vortex” ever since we have understood how different facets of Earth’s jet streams influence global weather. There is one at the bottom the world too. It is even more pronounced than the Arctic polar vortex because Antarctica is surrounded by ocean.
Mountains affect the way the jet stream flows. Even though mountains are generally not as high as the jet stream, surface winds are forced up over mountains and these air streams influence the jet stream above. No mountains over the ocean, so the Antarctic polar jet stream is stronger and Antarctica colder than the Arctic—one of the reasons why Antarctica is not warming as rapidly as the Arctic (also something that has been present in the models since the beginning).
So as the Arctic warms faster than the rest of us, there is more energy in the north (warmer), there is less difference in temperature between the south and the north and the polar vortex weakens. This allows polar air to spill southward and the rest is recent polar vortex history. The next catchy media phrase could very well be something related to Arctic Amplification or the process where the Arctic warms faster than the rest of us. Arctic amplification then is causing the polar vortex to weaken, larger bends and loops form in the jet stream and kick these arctic storms farther south.
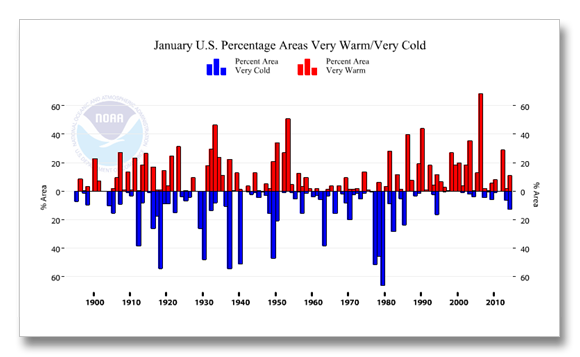
It appears to many of us that global warming is a hoax when in fact our winters have warmed so much over the last 20 or 30 years that normal twentieth century cold is an extreme event today. The NOAA graphic below illustrates this quite well. Although only for January, it’s quite obvious that since the mid 1980s it has been very warm on average across the U.S. a great deal more of the time than it has been very cold.
The entire U.S. has warmed 1.3 F on average; winters have warmed the fastest, the coldest states have warmed the most and nights have warmed 30% greater than days.
One of the most incomplete climate change denier talking points I have yet to run across is about how 2013 was the first year in 20 years where there were more low temperature records set than high temperature records.It is true that this is the first time in 20 years we have had more low temperature records than highs. Which shows how serious this global warming thing really serious. Normally half of the years we experience here on Earth should have more cold temperature records than warm. Looking at the NOAA graphic, prior to 1960 this is about what we experienced.
Instead, global warming has created a world where only 5 percent are colder than normal. But this assertion itself is subject to discussion. Yes it was colder than normal in parts of the country, but as the NOAA graphic above shows, across the country very warm temperatures covered exactly as much territory as very cold temperatures.
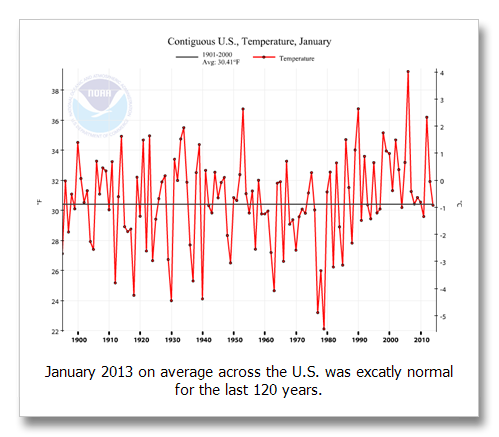
A stable climate should see exactly as many high temperature records as low temperature records, the number decreasing as the length of the record period grows longer. So over the last 20 years, we should have seen 10 that were colder than normal, not one. But back to reality: it’s not even been colder than normal. Out national average temperature in 2013 was exactly average last year.
Yes, there were 23 percent more daily low temperature records set in the last 365 days than daily high temperature records (lows 23,105, highs 17,896). But there were 32,003 new maximum low temperature records set—remember, nights warm more on a warming planet.
Daily records however, are not a very good indicator of a changed climate. All-time temperature records are.
All-time records tell us a lot more than daily records. All-time cold temperature records represent the coldest temperature reached on a single day in about 9,000 days of a 150 year temperature record for the three winter months (Dec/Jan/Feb). That’s one chance in 13,500. Daily temperature records represent one day per year in that 150 year temperature record or one chance in 475. All-time records are 28 times less common than an daily record.
In the last 365 days, the U.S. set 76 all-time high maximum temperature records, but only 12 all-time low temperature records. We set 633 percent more or six times more all-time high temperature records.
http://www.ncdc.noaa.gov/extremes/records/
Reality is a cruel mistress. Our climate is warming rapidly and the rate is increasing. But more warmth means more energy. The edges of the envelope are expanding. Heat extremes across the northern hemisphere are happening 10 to 100 times more frequently than they did 30 years ago. Both ends of the scale are expanding because of the increased energy and we will see more, likely even more extreme winter weather as our climate continues to warm. The winter extremes will only abate when overall warming increases more than the departure of the extremes.
Because the extremes are so much greater than projected warming, and because both ends of the scale are getting more extreme (heat and cold extremes) it will likely be a long, long time before winter weather extremes disappear.
To completely evaluate temperature records we need to look at low maximum and high minimum temperature records too because they both are related to climate change. Warmer nighttime temperatures reflect a warmer climate as cooler daytime high temperatures would reflect a cooling climate.
The total high max and low max temps (Warming climate) should then be compared to the total high min and low min temperature records: High max and low max = 49,899, high min and low min = 52,373, or 5% more cold records than warm. Statistically, just barely significant.
From the first Polar Vortex outbreak:
The records that were broken came from the 2003 cold spell, another in 1996 and another in 1986. But Cincinnati and Columbus failed to reach the cold minimums of 2009 and 2011.
Chicago and Minneapolis-St. Paul failed to break the top 10 for number of consecutive hours below zero.
Chicago’s all-time low is –27, January 6 this year was the coldest this winter at –16. Chicago is threatening their all-time number of days with below zero temperatures. They have 21 days below zero as of the 25th with three additional days this week forecast and the record of 25 days from 1885. Curiously, 2012 was the fourth warmest winter ever recorded in Chicago with the lowest temperature recorded of 6 above and the average number of below zero days is 13.
All-time records during the first Polar Vortex: There was one daily minimum all-time high temperature record set in Maine.
Contrast this “extreme cold” outbreak with the December 2013 heat wave where four all-time daily high temperature records were set that go back to the 1870s in Augusta GA, Norfolk VA, Jacksonville FL and Savanah GA, with another all-time high low temp record for December shattered by 6 to 9 degrees in the Baltimore/Washington area.
Globally, December was the third warmest December ever and January was the fourth warmest January ever.
Austin’s January National Weather Service 30-year average has increased 4 degrees. Austin’s 10-year average January temperature has increased 7 degrees; the 10-year January high has increased 9 degrees and the low 6 degrees.
January 6 was the coldest day of the outbreak across the U.S. and it ranked as the 40th coldest day in the U.S. since 1900.
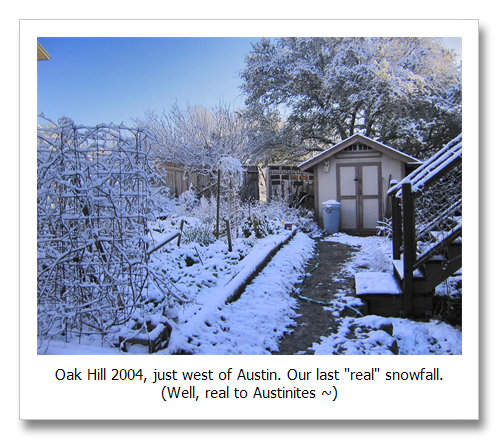
On the coldest day of the polar vortex outbreak at my house in Oak Hill it was 21 degrees at 8:30 am. At the same time in Glacier National Park it was 31 degrees.
Memory is a fickle thing: During the great Ice Bowl of 1967 the Packers played the Cowboys at -13 F at Lambeau field. The Packers game in the middle of this winter event was 5 degrees above zero.


