Does it seem like the droughts and floods are getting bigger, deadlier, and more extreme and dangerous? If you are not a climate change denier, it’s not your imagination. Droughts are indeed getting deeper, drier and longer, and floods bigger and more frequent. The research is widespread, and effects have now been felt by almost all of us, and the extremes we have been enduring lately are likely to be of the most frequent, everyday floods and droughts. Why? Because our climate has just recently warmed substantially beyond its natural variation, or the range of temperature and precipitation values where our Earth systems and humanity evolved. Because weather events are sporadic and highly variable, and because our climate has just now changed, the weather event frequency we can expect to find in our new climate is likely defined by the very short amount of time that our climate has been as warm as it is now, relative to the maximum warmth of the climate where we and our systems evolved.
This “Weather event frequency” is what drives engineering and weather safety in our culture. Because extreme weather events in our old climate were not common, 30 years of weather data were needed to ensure that we understood the extremeness of a 100-year storm to insure life and property against flooding for instance. Why 30-years of data for a 100-year storm? This is a normal function of statistical evaluation of weather data, where with at least 30-years of data, statistics can ferret out the likelihood of rainfall events more rare than the 30 years of data being evaluated, as long as the data are stable and not changing.
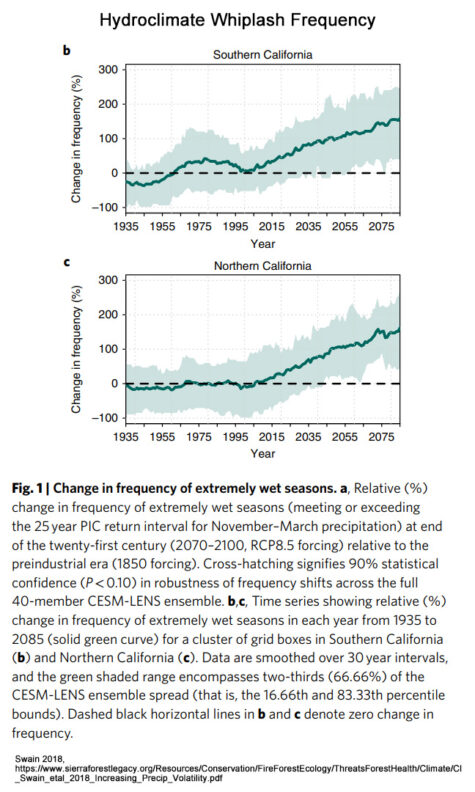
This new term, “Weather whiplash,” or more accurately, “Hydroclimate whiplash,” has now been defined by academic literature. Not only are floods and droughts getting more wicked, but tame weather is getting more rare. The reason is more energy in a warmer climate. Energy is one of the fundamental drivers of many things and it is peculiar in that, its relationship with temperature is nonlinear. That is, a little warming does not create a little more energy, it creates a lot more. This “lot more” energy is carried across our planet by the winds and weather systems that are affected by energy too, in nonlinear ways. Drought begets more drought for instance, because as it dries out, it heats up the local area because there is less moisture in the sky and a dryer atmosphere heats up more, nonlinearly more, which leads to nonlinearly more evaporation in a feedback loop.
Rainfall increases nonlinearly on a warming planet, because of a few things. One is that air can hold more moisture when hotter, about 7 percent more per degree C, or so we once believed. This relationship is a theoretical one, resolved in the lab. The latest research that includes field evidence however, from Nature, Scientific Reports, shows that a 1-degree C warming increases rainfall volume by 14 percent across 13% of the globe and almost 25% of the tropics. But this isn’t the biggest contributor to increasingly extreme flooding. Dynamic effects are the rule here. Additional moisture in the atmosphere allows more condensation in clouds, where condensation creates heat, and the increased heat causes additional lift, which increases condensation in a feedback loop. This heat engine has been studied in Hurricane Harvey and the Royal Netherlands Meteorological publishing says Harvey saw a 12 to 22% increase in rainfall versus the same storm modelled in our old climate.
The killer floods in Central Texas in 2025 followed extreme drought in a classic hydroclimate whiplash that NOAA has published about twice (see links below). Interestingly, they cite heat as the driver of the drought, where lack of precipitation was significant but not unprecedented. (See Heat, Not Precipitation, Now Driving Western Drought). They also confuse public understand by labelling the droughts according to Atlas 14 for Texas’ updated rainfall intensity criteria that these floods were one-thousand year events. These “X”-year event criteria are used by engineers to keep us safe from floods, heat, wind, snow, ice, drought, tides, tropical storms, hurricanes, and more. Generally, the 100-year storm is the threshold for preventative safety measures for insurance to be available. The science of what a 100-year storm is, tells us that it is the storm with a one-percent probability of happening in any year. Uhg. Scientists warn that it is not the storm that happens once every hundred years and that two or more 100-year storms could happen in any 100-year period, or none, or more… They tell us the probability story considering everyone knows what probability is when…, to most this is all about as clear as a glass of mud. The reality is that the 100-year storm is actually the storm that happens on average every 100-years -IF- very long time periods much longer than 100 years are considered.
So, NOAA tells us the killer storms of July 4 and 5, 2025 were of the 1,000 year event frequency according to the new rainfall intensity guidance from NOAA, Atlas 14 for Texas. True dat. But this misses the reality that we have all lived, that our culture is engineered to endure, that our insurance industry protects us against. Evaluated against NOAA’s old rainfall intensity guidance from our former climate with the old Weather Bureau’s Technical Paper 40 that engineers have used for generations to understand rainfall intensity, the Kerville flood was 2,500-year event, and the Sandy Creek/Cow Creek event northwest of Austin was a 3,500-year event. In other words, the old event in our old climate much more accurately shows the magnitude of rainfall intensity increase in Central Texas, that is reflected in the literature of globally increasing rainfall intensity because of warming. (See “It’s Flooding Down in Texas, Melton, July 31, 2025, Rag Blog, and the associated podcast, and Climate Change Now’s Instagram film logs, here, here, and here.) One other thing is very important to understand with this relative discussion of how much rainfall intensity has increased on a warmer planet.
This is that NOAA’s new Atlas 14 from 2018, assumes the data are stationary and that normal statistics can ferret out exactly what a 100-year storm inour changed climate, like with the Old Weather Bureau’s TP 40 that engineers have used for generations. This however simply is not happening. The reason was alluded to earlier, “the data must be stationary and not changing.” Well, of course the data are changing, and this means they are not stationary. the problem this creates with traditional statistics is that results for rainfall intensity with changing data are up to 60 percent understated, and that the more recent and larger that changes, the greater the understatement. (See Cheng and AghaKouchak 2014 below)
On the other side of the whiplash, heat now drives drought, not precipitation. Work out of UC Los Angeles, NOAA, and the Cooperative Institute for Research in the Environmental Sciences (CERES), University of Colorado, Boulder, tells us that more energy in our world from warming, nonlinearly increases evaporation from water bodies, soil, and plants, and that the influence of warming has now surpassed lack of precipitation as the main driver in increased drought. (Zhuang 2024 below). Flash droughts now rule the planet. They are influenced by the evaporation feedback. This is not our normal climate any longer. (Yuan 2023 below). Megadrought and megaflood conditions have already become average conditions in the US West and Europe (Stevenson 2023). The southwestern North American megadrought is now the most extreme in over 1,200 years, or the most extreme of any megadrought on record in this region for which we have proxy records (See Williams 2022 below), and this sub-continental-scale drought has significantly intensified since data for this evaluation were collected in 2021.
What to do? Prepare and restore. First prepare. The next megadrought or killer flood may be yours. Prepare for extreme conditions far more extreme than what the National Weather Service has suggested we prepare for in emergency situations. Use the same preparations, but enhance them for bigger floods and longer hotter droughts and more frequent occurrences. This means prepare the grid in Texas for worse than the worst-case scenario with data centers sucking up all the electricity. Even more important, these extremes are guaranteed to increase in extremeness nonlinearly in the future, even if we could magically halt all warming tomorrow morning. The reasons is that frequency analysis bit above: our climate has just now warmed to its current temperature and much more rare and extreme events will occur as time pases. The only way to prevent catastrophe far beyond imagining is to restore our climate – this is not to be confused with net zero and or the elimination of human-caused greenhouse gas emissions. These only reduce future warming and warming effects. It is current warming that has caused the whiplash, and even with magical warming cessation, rare events will still occur with far greater consequences. restoration then, by removing the excess, human-emitted greenhouse gases in our atmosphere, and through emergency temporary cooling, is the only way to ensure that extreme events do not increase nonlinearly to conditions wildly beyond what we have seen recently.
Hydroclimate Whiplash …
Swain et al., Hydroclimate volatility on a warming Earth, Nature Earth and Environment, January 9, 2025.
(ResearchGate – Download with free account) https://www.researchgate.net/publication/387865117_Hydroclimate_volatility_on_a_warming_Earth
Weather Whiplash in Texas: Drought to Flood, NOAA
https://psl.noaa.gov/news/2025/texasfloods.html
From Dust to Deluge: Weather Whiplash Devastates Texas, NOAA
https://www.drought.gov/news/dust-deluge-weather-whiplash-devastates-texas-2025-07-23
Extreme rainfall increases nonlinearly with about 13% of the globe and almost 25% of the tropics seeing a 14% increase in rainfall volume per degree C, instead of the normal 7% increase per degree… “Daily precipitation extremes are projected to intensify with increasing moisture under global warming following the Clausius-Clapeyron (CC) relationship at about 7%/◦ C . However, this increase is not spatially homogeneous. Projections in individual models exhibit regions with substantially larger increases than expected from the CC scaling. Here, we leverage theory and observations of the form of the precipitation probability distribution to substantially improve intermodel agreement in the medium to high precipitation intensity regime, and to interpret projected changes in frequency in the Coupled Model Intercomparison Project Phase 6. Besides particular regions where models consistently display super-CC behavior, we find substantial occurrence of super-CC behavior within a given latitude band when the multi-model average does not require that the models agree point-wise on location within that band. About 13% of the globe and almost 25% of the tropics (30% for tropical land) display increases exceeding 2CC. Over 40% of tropical land points exceed 1.5CC. Risk-ratio analysis shows that even small increases above CC scaling can have disproportionately large effects in the frequency of the most extreme events. Risk due to regional enhancement of precipitation scale increase by dynamical effects must thus be included in vulnerability assessment even if locations are imprecise.”
Villalobos and Neelin, Regionally high risk increase for precipitation extreme events under global warming, Nature Scientific Reports, April 5, 2023.
https://www.nature.com/articles/s41598-023-32372-3
Hurricane Harvey, 2017 was made three times more likely because of climate change… Not 7% more rain, 12 to 22% more” During August 25–30, 2017, Hurricane Harvey stalled over Texas and caused extreme precipitation, particularly over Houston and the surrounding area on August 26–28. This resulted in extensive flooding with over 80 fatalities and large economic costs. It was an extremely rare event: the return period of the highest observed three-day precipitation amount, 1043.4 mm 3dy−1 at Baytown, is more than 9000 years (97.5% one-sided confidence interval) and return periods exceeded 1000 yr (750 mm 3dy−1) over a large area in the current climate. Observations since 1880 over the region show a clear positive trend in the intensity of extreme precipitation of between 12% and 22%, roughly two times the increase of the moisture holding capacity of the atmosphere expected for 1°C warming according to the Clausius–Clapeyron (CC) relation. This would indicate that the moisture flux was increased by both the moisture content and stronger winds or updrafts driven by the heat of condensation of the moisture… Our scientific analysis found that human-caused climate change made the record rainfall that fell over Houston during Hurricane Harvey roughly three times more likely and 15 percent more intense.”
van Oldenborgh et al., Attribution of extreme rainfall from Hurricane Harvey, August 2017, Environmental Research Letters, December 13, 2017.
https://iopscience.iop.org/article/10.1088/1748-9326/aa9ef2/pdf
Non-stationarity underestimates extreme precipitation by as much as 60 percent… “Extreme climatic events are growing more severe and frequent, calling into question how prepared our infrastructure is to deal with these changes. Current infrastructure design is primarily based on precipitation Intensity-Duration-Frequency (IDF) curves with the so-called stationary assumption, meaning extremes will not vary significantly over time. However, climate change is expected to alter climatic extremes, a concept termed nonstationarity. Here we show that given nonstationarity, current IDF curves can substantially underestimate precipitation extremes and thus, they may not be suitable for infrastructure design in a changing climate. We show that a stationary climate assumption may lead to underestimation of extreme precipitation by as much as 60%, which increases the flood risk and failure risk in infrastructure systems.”
Cheng and AghaKouchak, Nonstationary Precipitation Intensity-Duration-Frequency Curves for Infrastructure Design in a Changing Climate, Nature Scientific Reports, November 18, 2014.
https://www.nature.com/articles/srep07093
Heat, not precipitation, now drives drought in the U.S. West… This modelling suggests the Western U.S. drought of 2020-2022 was a 1,000-year event in our old climate, a 60-year event by mid-century and a 6-year event by the late 21st century. But modeling is understated, almost entirely across the board, because of unknowns in the rate of collapses and emissions of previously stored carbon as greenhose gases, and form other very critical issues like albedo, or the reflectivity of landforms and vegetation. This is illustrated by two things: loss of snow and ice cover, where snow reflects up to 90 percent of the sun’s light harmlessly back into space, and vegetation, earth, rocks and water absorb up to 90 percent of sunlight and change it into heat where it can be trapped on Earth by the greenhouse effect. The other is more subtle but still vitally important. Loss of tree cover exposes a darker forest floor, that absorbs more light and more heat created, it evaporates less water which cools as it evaporates, and the local warming further reduces the forest’s ability to regenerate where this ability is already degraded and failing in some forests.
Zhuang et al., Anthropogenic warming has ushered in an era of temperature-dominated droughts in the western United States, Science Advances, November 6, 2024.
https://www.science.org/doi/epdf/10.1126/sciadv.adn9389
Flash Droughts Now Rule the Planet… Flash droughts are droughts that begin much faster than traditional droughts because of warming feedbacks. These feedbacks are largely driven by the temperature/evaporation feedback where warmer temperatures create nonlinearly more open water evaporation, soil evaporation and evapotranspiration (from plants). In other words, a little warming does not create a little more evaporation, it creates a lot more. The other feedback is the precipitation deficit feedback where less rainfall during climate change-caused dry periods accelerates normal drought development. Three-quarters of land area on Earth are now transitioning to faster onset flash drought that develop within a few weeks instead of much longer time spans for drought in our old climate. These new, faster onset droughts create challenges with traditional drought monitoring science that was developed to show intensity of slowly accelerating droughts, biasing these monitoring data low. Flash droughts can trigger compound impacts like heat waves and wildfire much faster than traditional droughts. They may have greater impacts on ecologies because they develop more rapidly with higher temperatures. Because our ecologies evolved with slow onset drought, flash drought has the capacity to overwhelm this evolution creating what the researchers call “a rapid reduction in ecosystem productivity.” Stresses caused by the increased rate of drought have significant implications for plant’s ability to fend off disease and insect attack as well is the creation of increased mortality.
Yuan et al., A global transition to flash droughts under climate change, Science, April 14, 2023.
https://www.science.org/doi/epdf/10.1126/science.abn6301
Megadrought and megaflood conditions have already become average conditions in the US West and Europe… “Soil moisture changes are so large in some regions that conditions that would be considered a megadrought or pluvial event today are projected to become average. Time-of-emergence calculations suggest that in some regions including Europe and western North America, this shift may have already taken place and could be imminent elsewhere.”
Stevenson et al., Twenty-first century hydroclimate: A continually changing baseline, with more frequent extremes, PNAS, March 14, 2022.
https://www.pnas.org/doi/epdf/10.1073/pnas.2108124119
The southwestern North American megadrought is now the most extreme in over 1,200 years, or the most extreme of any megadrought on record in this region for which we have proxy records… This doubles the time frame from previous findings.
Williams et al., Rapid intensification of the emerging southwestern North American megadrought in 2020–2021, Nature Climate Change, February 14, 2022.
https://escholarship.org/content/qt6sm1c6hf/qt6sm1c6hf_noSplash_2b3c87cbd9e5a8f9cb58a824b0050f10.pdf