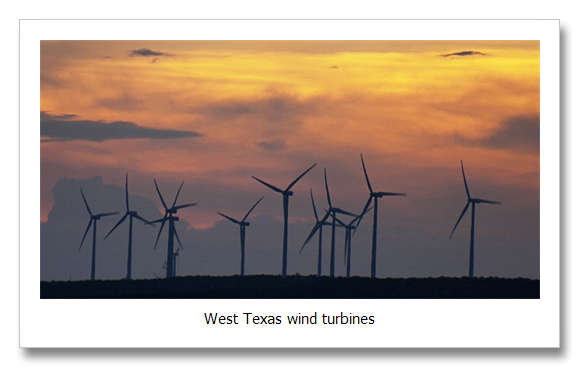
Forbe’s states: “Higher electricity prices in states producing the most wind power are taking a devastating toll on disposable incomes and the overall economy… From 2008-2013 electricity prices rose an average of 20.7 percent in the top 10 wind power states, which is seven-fold higher than the national electricity price increase of merely 2.8 percent.”
The article plays the Federal 2.3 cent per kWh tax credit pretty hard as being responsible or “hiding” 20 percent of the cost of wind energy on the consumer’s nickel at an average US electricity cost last year of 10.8 cents per kWh.
On top of the phantom consumer tax, the article claims that Coloradoans paid an additional half billion dollars in electrical bills last year vs. if electricity in that state had only gone up at the national average. This is $250 per person. Minnesotans paid an additional $476, Kansans and extra $636.
The Forbes author (James Taylor) tells us “The wind power industry’s fallback position is wind power benefits state economies, despite rapidly rising electricity costs, because the switch from conventional power to wind power generates jobs within the wind power industry. This argument, however, amounts to nothing more than a misleading head-fake.” The rest of this author’s tale spells out a truth about wind energy that one never hears from Conservative minded individuals.
Environmentalist (and the Wind Industry) tell us that these new alternative energy sources create jobs. Conservatives tell us they kill jobs. Taylor does get at the truth in this area, at least significantly at the truth. New alternative energy sources shift jobs. They kill jobs in fossil fuels and create jobs in wind in this instance.
But then Taylor shows his true Conservative leaning (it’s Forbes…) and his prose disintegrates into invalid or misplaced talking points the biggest of which is how much cheaper conventional power is than alternatives. All the while, this Forbes article never once looks down the road just a few years.
This spring in Austin and within the last year at four other places in the U.S., wind went for 5 cents per kWh. In Austin, the July report from the Austin Generating Task Force has coal at 5.5 cents per kWh, nuclear at 10.4 cents, and natural gas at 2.9 to 10.8 cents per kWh. The cheapest energy in Austin today is from a contract for wind signed by Council in February for 2.6 to 3.6 cents per KWh.
The Department of Energy was looking at $0.05 to $0.07 per kWh of commercial photovoltaic energy by 2017 as recently as 2011. (link) The price for new alternatives today is the same as or decisively cheaper than anything but fracked natural gas. and this is today.
So what is all this business about alternative energy states seeing energy prices rise seven times faster than non alternative energy states? Wind and solar were once much more expensive than today, where they are decisively less expensive than coal, and nearly so or equal to wind. This did create an increase in average energy costs, but seven-fold?
Looking at Texas–the biggest alternative energy source in the nation—total energy sales have increased 5.7 percent since 2003, yet revenues have increased 43 percent according to the US Energy Information Administration (EIA) Electric Power Monthly Report for December 2013. (1)
Costs for wind energy continues to fall and solar continues to plummet. If this evaluation from Forbes is even valid, it will not be for long.
References:
Forbes’ Article: http://www.forbes.com/sites/jamestaylor/2014/10/17/electricity-prices-soaring-in-top-10-wind-power-states/
1) US Energy Information Administration (EIA) Electric Power Monthly Report for December 2013, Tables 5.1 and 5.2: Table 5., Retail Sales of Electricity to Ultimate Customers:
Total by End-Use Sector, December 2003 — 3,493,734 million kWh and December 2013 — 3,691,789 million kWh. Table 5.2 Revenue from Retail Sales of Electricity to Ultimate Customers:
Total by End-Use Sector: December 2003 – $259,767,000,000, December 2013 – $372,208,000,000.

