Even the extreme rainfall we experienced with Harvey is not the new normal. As warming increases, so do extreme weather events. Importantly, a little more warming does not increase extremes a little more, it increases them a lot more because of the physics of thermodynamics. The way this physics works is that a little warming does not increase extremes a little, it increases them a lot.
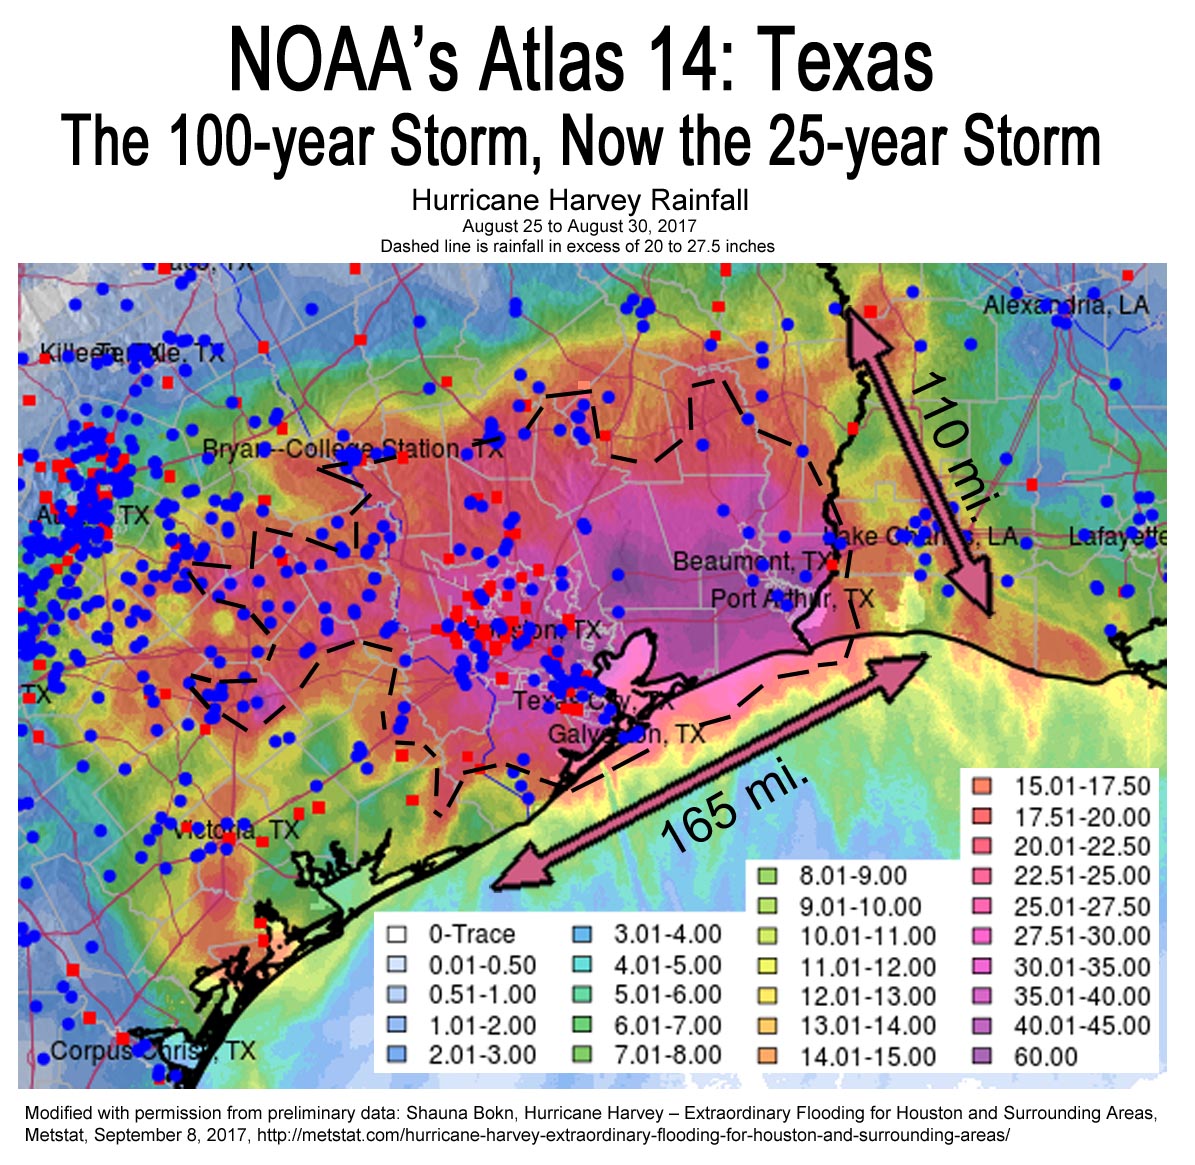
Atlas 14: Texas – The 100-year Storm is Now the 25-year Storm, Already
In Houston, the 100-year storm in our old climate was 12.5 inches in 24 hours. The new rainfall data analysis just released by NOAA shows the 25-year storm total is now 12.1 inches. The 100-year storm total has increased to 17.9 inches, an increase of 43 percent. In Austin, the 100-year storm in our old climate was 10 inches in 24 hours. The new Atlas 14 shows the Austin 50-year storm is now 10.6 inches and the 25-year storm is 8.86 inches.
These brand new numbers in Atlas 14 however, are biased low. The statistical analysis used by NOAA relies on long-term weather data to prove statistically that rainfall is increasing in intensity. Because the increase of extreme rainfall events we have been seeing lately in some areas has just begun over the last 10 or 15 years, the new statistical analysis averages them low. This is not about future increases in rainfall intensity, it is about NOAA’s evaluation of increases in intensity that have already occurred. The extreme rainfall events we have been seeing in some areas in Texas are not well captured by NOAA’s new work because they make a statistical analysis assumption that creates a significant low bias in their results. From the new Atlas 14 for Texas:
4.5.5. Trend analysis
The precipitation frequency analysis methods used in NOAA Atlas 14 are based on the assumption that the annual maximum series used in the analysis are stationary.
The “annual maximum series” is the daily rainfall data or the rainfall dataset for any given rain gauge. This “assumption that the annual maximum series used in the analysis are stationary”, means that the analysis had to assume the data were not increasing. This is one of the fundamentals of statistics. The science of statistics works on a stable data set. It can tell us what the average is, (the mean,) what the median is (the middle number of the range of data), the mode (the most often occuring piece of data, and the chance (probability) that any given piece of data will recur (confidence limits.)
When a trend rapidly changes though, it takes decades of data with rainfall and temperature to create a stable, or stationary data set. So if a dataset is not stationary, the statistics will be wrong.
In other words, because the trend of extreme rainfall events has just recently increased in extremeness, the recent increase is averaged in to the rest of the dataset. For Texas, that’s an average of 60 years of rainfall data with Atlas 14. So when the last 10 or 20 years of increasing rainfall extremes are averaged in with 60 years worth of data, the results are an understatement of the meaningfulness of the trend. So the old 100-year storm in Austin is very likely not the new 25-year storm, it is something that occurs more frequently, and likely much more frequently, like the 10-year, 5-year or even the 2-year storm.
The great challenge is that we as a civilization have never had to deal with this kind of thing before. It breaks the standards of statistics that have been used for generations to define weather for engineering design. I bring it up in academic circles at the City of Austin, and with our State Climatologist here in Texas, and none of them know what to do. A bleeding edge piece of academia on what to do about is Francois et al., Design considerations for riverine floods in a changing climate – A review, Journal of Hydrology, April 2019. A copy can be found at ResearchGate, an academic clearinghouse for paywalled papers like this one, though a free account is needed to access.
The City of Austin did a frequency analysis of the Halloween 2015 flooding in Southeast Austin. They calculated this storm of 12 to 13 inches of rain was about a 2,000-year storm. The 2013 Halloween floods in Austin, and the May 2015 flood on the Blanco River in Wimberly and San Marcos were similar events. The Hurricane Harvey floods east of Austin were the result of greater than 20 inches of rain, which would be a storm much more extreme than the 2,000 year storm in Austin.
The Harvey event from Houston to the Louisiana border has been estimated by Metstat to be a 25,000-year storm. Harris County Flood Control District said the average rainfall across Harris County was a 3,000 to a 20,000-year storm, and that their maximum rain gauge totals Harris County of 47 inches was a 50,000-year storm. The Capitol Weather Gang in DC with seven meteorologists said the 60 inch totals associated with Harvey represent a textbook example of a one-million-year storm.
Kerry Emanuel at the Massachusetts Institute of Technology says that today, already, Harvey was a 16-year storm, or a storm that recurs every 16 years on average. This forward-leaning modeling evaluated 3,700 synthetic Harvey-like storms in each of three different climate models between 1980 and 2016, that crossed the Texas coastline at any point. Under business as usual in 2100 if we do not control warming, Harvey–like storms will happen every 5.5 years in Texas.
Three other things are very important in this discussion of why our climate changing faster than expected and why:
Rainfall extremes increase nonlinearly with warming. So a little more warming will not produce a little more extreme weather, it will produce a lot more extreme weather.
This is a very simply physical relationship between energy and temperature. As it warms, energy in the environment does not increase at the same rate as warming does, it increases more. And, as it get’s hotter, the energy increases even more than at cooler temperatures.
The industry of science and scientists understate as a rule.
The reasons are many. Rapidly changing trends are not well captured by current statistical analysis as is evident by the new Atlas 14 evaluation. Scientists are reticent to overstate, because if they are wrong the peer review journals will think twice about publishing their work.
Science is slow. It takes ten or more years for a very significant amount of scientific findings to go from hypothesis to data collection to published findings. (Emanuel’s work on Harvey-like storms was an exceptional case with exceptional cause.)
Topping the list of why climate change is way out ahead of the science is climate science consensus organizations like the Intergovernmental Panel on Climate Change (IPCC.)
Any time two or more experts are brought together to create a consensus statement on something, a compromise most often results.
This compromising almost always understates the latest and most accurate academic publishing. The actual results of Harvey are a prime example. We were not supposed to see such astonishing increases in hurricane extremeness until well into the later half of the twenty-first century, if then.
The final reason is that modeling increasing extreme weather events is very difficult.
We can model average climate really well and this is because climate models average together hundreds and even thousands of individual runs. This completely disregards the fact that models can’t get the 7-day forecast correct, because the 7-day forecast has to do with extremes. Averages are easy.
It’s the extremes that are difficult to model. So, climate science excludes the extremes. They are caveated out of the consensus statements. This is a really bad thing for us humans because it really is the extremes that matter most. But until we can model the extremes well, the science will continue to caveat them out of their reports.
An example of how significantly the climate consensus understates comes from the 2013 IPCC report. This report tells us that by 2081 to 2100, Houston will see up to a ten percent increase in total 5-day, 20-year precipitation accumulation. (Figure 12.26, page 1083) This total 5-day precipitation for the 20-year storm in our old climate was about 11.5 inches. In Atlas 14, the depth is about 16 inches, an increase of 39 percent — already, in 2018, not 2081 to 2100. The actual numbers from the new Atlas 14 (which is understating in itself) are 60 to 80 years ahead of schedule and three times as much as IPCC projected.
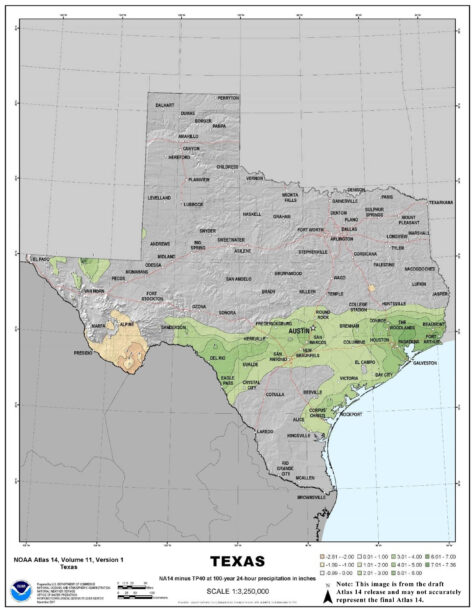
This graphic shows where and how much rainfall has increased for the new NOAA Atlas 14 vs. the old NOAA evaluations from the 20th century. Many areas have remain unchanged, but changes in others have been large. This reflects fairly accurately the general rainfall projections under a warmer climate where inland areas will become drier and coastal areas will become wetter. Only it’s happening much ahead of schedule.
It’s also very interesting to note that the increase is not uniform in all areas. In Texas, the greatest increases in rainfall extremeness are along and roughly parallel to the coast, with the highest values towards Louisiana, and little change in northern areas of the state. But remember; these new numbers are understated, and in addition, a little more warming will create a lot more extremes.
Climate scientists told us 30 years ago that weather extremes would increase on a warmer planet. But even today, the projections of exactly how much they will increase are either so vague that they are not really meaningful, or they are wildly underestimated. (See here, here, here, here, and here.)
We have the capacity to model these things, but 30 years of modeling has conclusively shown that the models badly underestimate. The confidence for this extreme event modeling is so low that it cannot be used in consensus publications upon which policy is based.
But this badly underestimating characteristic of climate science is not the only worrisome part of the critical path of warming and how it relates to rainfall extremes. What we are seeing happening in our natural world is happening so fast that the science cannot keep up.
Scientific reasoning, like has been developed for evaluation of rainfall extremes, uses historical observations. To produce statistical confidence in historical observations, we have to have long-term records. With weather, 30 years is considered adequate to develop the confidence needed to say something is so. Less than 30 years and natural variation, or chaos in our weather, is too great to be able to make accurate statements.
This statistical thing is one of the biggest reasons why we seem to always here that “we cannot tell if this one single weather event was caused by climate change or not.” If we had 30 years to wait around before making this proclamation, enough data would have been accumulated for the statistical confidence to be high enough that we could say whether or not that extreme event was caused by climate change.
In the absence of 30 years of waiting, a new field of science has grown up called “weather event attribution.” This science uses statistics way beyond my pay grade to attempt to shorten the amount of time needed to make a proclamation of whether or not any given weather event was either caused by or enhanced by climate change. But climate science still has a lot of trouble with how much climate change has caused or enhanced a single weather event. And the widespread notion that “we just can’t tell…” makes the outreach even more difficult.
Yes we can tell. All we have to do is use common sense and logic. Climate scientists said our planet would experience more extremes when it warms. It’s warmed.
Using Hurricane Harvey as an example, numerous climate scientists and a few academic works have helped us understand the reasons why warming enhances hurricane extremeness, but pinning down exact amounts is another question entirely. We have found with Harvey that many things increased the flooding experienced in that storm including: increased water temperature that drives the heat engine of a hurricane; increased depth of warmer water where hurricanes once churned up cooler water that diminished hurricane strength; increased air temperature that increases the amount of moisture the air can hold and thus rain out; increased sea level that increases the amount of flooding from storm tides and decreases the amount of rainfall runoff that can flow into the ocean; and decrease in the strength of steering current winds, both modeled in a warmer climate and now observed as actually occurring, where the decreased steering currents allow storms to stall out longer than in our old climate.

Not the New Normal: Atlas 14, 100-year, 24-hour storm. Click for larger image.
And we have to be careful of how we read the popular press reporting these attribution findings. Using Hurricane Harvey as an example again, widespread reporting said that “record” ocean temperatures were one of the reasons Harvey was enhanced by climate change. What they don’t say is how our brains react to the discussion of “record temperatures.”
In our old climate, a record weather extreme was a relatively rare event. As individuals, we would experience a temperature record within our sphere of existence on the television weather report, a few to several times a year. Today however, these records are happening much more often. In the U.S. is the last 365 days there were 2.13 new record high temperatures for every 1 new record low temperature. In a stable climate, this ratio would be 1 to 1. In the 1950s, the ratio was 1.09 to 1.
The other thing about today’s record ocean temperature for example is that almost every year sets a new record. Our old understanding of what “record ocean temperature” means is just not valid any more. The record ocean temperatures that Harvey encountered are now normal. But it’s not the “new normal.” Every year it gets warmer. Tomorrow’s “normal” will be warmer than today’s.
So Atlas 14 is a very useful tool. It tells us that rainfall has indeed increased a lot already, it’s not just our imaginations or natural cycles. But on a warmer world, a little more warming does not create a little more extremeness. Thermodynamics are at play. A little warming creates a lot more dynamic response, meaning that a little more warming does not create a little more extremeness, it creates a lot more.