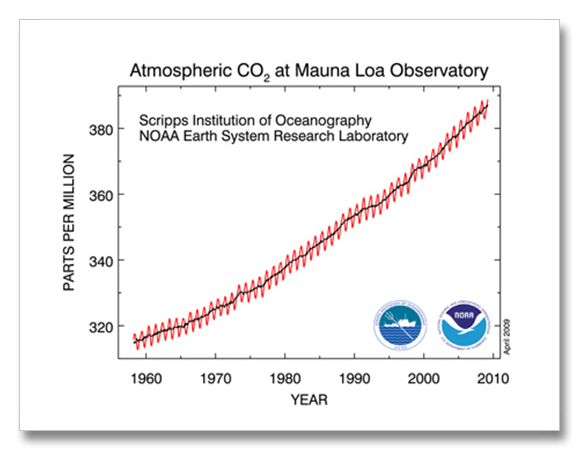
Well it did not happen, at least not yet. The economic crisis has not affected CO2 concentrations in the atmosphere. They continue to rise at an even faster rate than just a few years ago. The graphic on the right is probably familiar to most. This is the Keeling Curve, developed by Dr. Keeling at Muana Loa in Hawaii. He started measuring CO2 when everyone thought he was nuts back in the late 50s. Well, Dr. Keeling turned out to be the sane one…
His graph of course is the telltale signature of climate change: that every increasing curve trending off of the top of the chart. But this graph has always left me a little underwhelmed. I took Dr. Keeling’s data – the computed annual CO2 concentration change
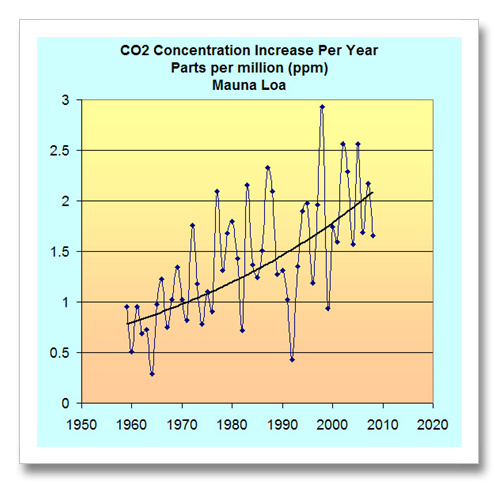
by NOAA’s Earth Systems Research Lab (ESRL) and plotted them instead.
The blue line connects the part per million (ppm) change every year, which is quite variable, but the black line is the trend, or the "smoothed" average. About 1960 the concentration of CO2 in our atmosphere was between 0.7 and 0.8 ppm. Last year, it was almost 2.1 ppm.
While the increase in the Keeling Curve graph at the top (from less that 315 to 386 ppm) is about 23%, the increase of the rate that CO2 is increasing (bottom graph) is nearly 300%! Why don’t the scientists show us this image instead of the one that has a 23% increase since 1960?
I have to repeat this it is so important: CO2 has increased 23% since 1960. But more importantly, CO2 is increasing three 300% faster than it was in 1960. The importance of the difference can not be understated.


