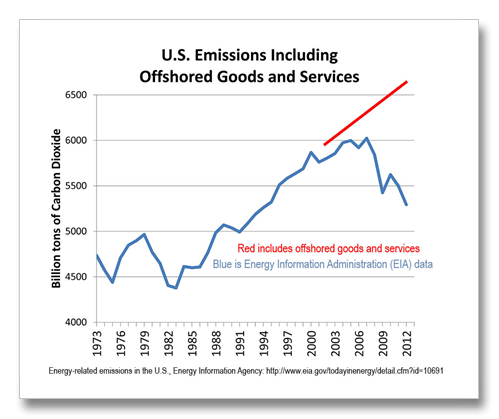
Even though global emissions are way up, US carbon dioxide emissions appear to be way down; down 16 percent since the peak in 2007. This would be good, but it’s a mirage. In 2011, 1.5 gigatons of CO2 were offshored in China (mostly) through goods produced there and shipped to the US. This leaves the US with an increasing, not decreasing, inventory in 2011. Our emissions have actually increased 11 percent since the "peak" year before the decline began in 2007.
National greenhouse gas inventories tell us how many greenhouse gases were emitted in a given country. The way they calculate it, emissions are allocated to a country based on when and where the emissions happen. Emissions of greenhouse gases from fossil fuels burned in Mexico for example are attributed to Mexico’s greenhouse gas inventory. Emissions from coffee bean farming in Costa Rica are attributed to Costa Rica. Emissions from tourists visiting Japan are attributed to Japan. Emissions from goods and services produced anywhere and consumed elsewhere, are attributed to the country where the goods and services were produced.
The emissions from all that stuff that was once made in the U.S. but is now made in China or Korea or Taiwan or wherever, stays in China or Korea or Taiwan or wherever. No wonder our emissions are going down. Sixty percent of our consumption in 2011 was imported whereas in 1990 only 35 percent was imported. Compare this to 1980 when 30 percent of the goods we consumed were imported.
Part of the reason that U.S. emissions appear to be falling is the fracked gas boom. Gas has replaced a lot of coal electricity over the last half dozen years and gas produces less CO2 per energy unit than coal. So our emissions fall. But our consumption of goods and services has continued to increase, and the percentage of goods and services that we produce in the U.S. continues to fall.
The understanding that American’s emissions are falling is not even close to being true. Actual emissions are some 25 to 30 percent higher than the figures put out by the IEA because the U.S. has been shifting our Made in the USA manufacturing to Made in China for so many years.
In addition, fracked gas produces three to four times more methane than conventionally produced natural gas. Most understand methane to be 25 times more potent of a greenhouse gas than CO2 and it is, in long term time frames of 100 years. But in time frames that matter of less than 20 years methane is 108 times more potent.
U.S. greenhouse gas emissions decrease is a mirage… US Inventory of U.S. Greenhouse Gas–Emissions and Sinks: 1990 – 2011: http://www.epa.gov/climatechange/Downloads/ghgemissions/US-GHG-Inventory-2013-Main-Text.pdf
Offshored Emissions: Global Carbon Atlas, http://www.globalcarbonatlas.org/?q=emissions
Under Transfer button, the U.S. has transferred 410 Mt Co2 in 2011.
Le Quere, et. al., Global Carbon Budget 1959 to 2011, Earth System Science Data, 5, 165-185, 2013.
http://www.earth-syst-sci-data.net/5/165/2013/essd-5-165-2013.pdf
http://www.globalcarbonatlas.org/?q=emissionshttp://www.globalcarbonatlas.org/?q=emissions
http://www.eia.gov/environment/emissions/carbon/?src=email
U.S. Energy-Related Carbon Dioxide Emissions, 2012
http://www.eia.gov/environment/emissions/carbon/pdf/2012_co2analysis.pdf
Davis and Caldiera, Consumptive-based accounting of CO2 emissions, PNAS, March 3 2010. Figure 2 shows 520 Megatons (0,53 Gigatons) outsourced by the U.S. in 2008.
http://www.pnas.org/content/107/12/5687.full.pdf


