How many times in the reporting of this event have you heard that we still cannot tell if any single weather event is caused by climate change?
It is time we stopped comparing climate change caused weather events with similar events in the past. Our country is suffering through a second year in a row of drought as bad as or worse than the Dust Bowl. Climate scientists say that Dust Bowl drought and heat will be the average condition while you and I are still alive. This means that weather events like the Dust Bowl will become 50 to 100 times more frequent, while you and I are still alive. Considering that a Dust Bowl drought is about a one in a hundred year occurrence, to go from a once in a hundred year thing to a thing that happens every year or two within the time span of several decades, this means, like I have said before–if this is not climate change happening right now, this is exactly what climate change will be like in the very near future.
Over four days in July, satellites observations showed what would normally be called a freak event in Greenland. The entire surface of the Greenland Ice Sheet melted, or more accurately, satellite observations tell us that 97 percent of the surface of the Greenland Ice Sheet melted.
Google Maps Link to Kangerlussuaq: http://goo.gl/maps/1IUBr
Normally only 25 to 50 percent of the surface melts every year, but three times in the last fifteen years we have seen extraordinary melt events during the summer. Things have changed in Greenland.
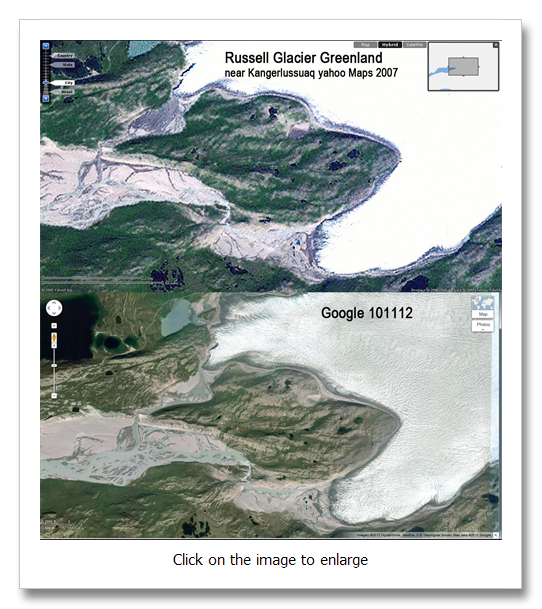
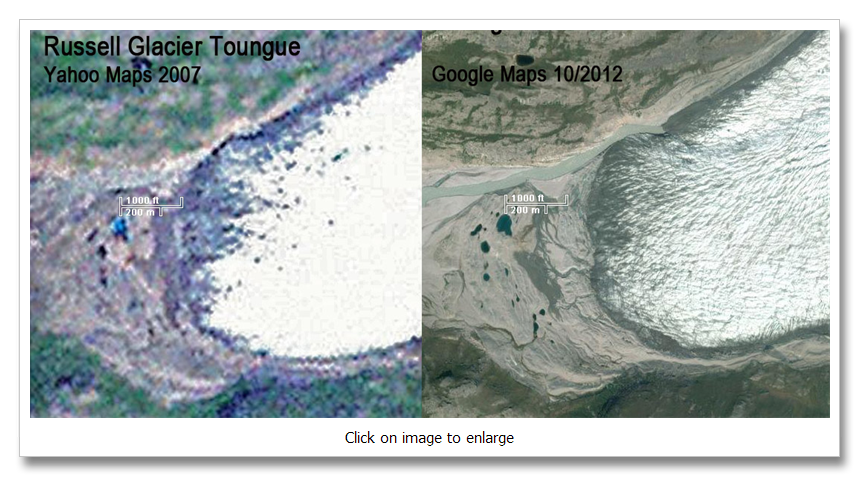
When I was there in 2007, the climate scientists on the ice were talking about “The Big Melt.” It began in 2002 with a 76 percent melt and continued in 2004, 5, 6 and 7, with two 58 percent melts and two 53 percent melts–all greater than anything else recorded. Twelve of the last 17 years have seen melt greater than anything in the previous 16 years. The Google Map below shows the Russell Glacier, which is about a mile from where I camped. Zoom in, zoom out. The Greenland Ice Sheet is an amazing thing.
The images below and on the right were captured from the Google and the Yahoo at a location about a mile from where I camped. I had been using 21st century technology to see what I was in for because I had a vague idea about where I might be able to camp. I saved some of the screen captures and sure-nuf, one was close. Much of the imaging for Greenland is not this high resolution, but some of it is. In a place as remote as Greenland, maybe they are just having a hard time dedicating the resources to get all the available high res imagery up – or who knows. But what I have captured is astonishing.
On the long trip (all of 18 miles) from Kangerlussuaq to the edge of the ice, my guide told me that in the last three or four years, melt had bee so great that 100 feet of vertically of ice had melted. When we arrived at the ice, the old road up onto the ice sheet hung high in the air. You see, the edge of the ice sheet is anywhere from 50 to 200 feet high. Volkswagen had built this road in 2003 to access a winter proving ground 70 miles inland.
I later learned that they had asked some of the ice scientists if their location was good. The ice scientists said “no,” and that even though their location stayed frozen year-round now, at the rate warming was progressing they needed to build much further inland. They promptly ignored the ice scientists counsel and by 2007 their winter proving grounds had melted entirely.
The road they built was along a medial moraine—one of those giant piles of debris bulldozed by the movement of the ice outwards towards the sea. In its middle, at its highest, the ice sheet is nearly 11,000 feet high. It pushes outwards from sheer weight. But there is a point around its edges where melt in summer equals the “push” from inland.
Researchers from the University of Illinois at Chicago and the Byrd Polar Research Center at Ohio State looked at this area for a paper published in 2007 (Field work was done in 2004) and found that it had been stable for 100 or more years. They looked at lichen growth rates on bedrock (mm per decade in these regions) and the surface of boulders exposed as they were discharged from the ice margin. Think of the ice sheet as a conveyor. It is constantly moving and along it’s edge, melt equals the outward movement. A long pile of rocks and sediment develops as this process continues for long periods. The pile looks for all the world like it was bulldozed but that’s not how it got there.
So these clever scientist can not only tell how long the adjacent areas had been ice free from the growth rate of lichens, they can look at the surface of the moraines and tell by a process called luminescent dating, how long the material on the top of the moraines had been exposed to cosmic rays.
Since I was there the melt has continued. From The Google, it looks as the snout of the Russell glacier had receded another 200 feet. One thing to remember about Greenland melt and science is that science take a long time. These researchers were in the filed in 2004 and their paper was not published until 2007. Melt has accelerated since. The science keeps getting scarier and scarier, but even the newest science is going to be three years old.
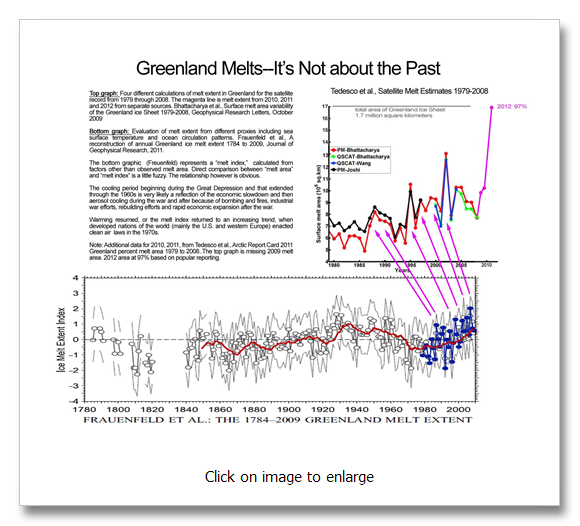
The satellite record so prominent in the discussion only goes back to 1979, but a much longer recreation of melt in Greenland can be seen below in the graphic “Greenland Melts-It’s Not About the Past.”
What the long term melt record in Greenland shows is steady warming since the end of the Little Ice Age punctuated by a cooling that begins and ends identically to the global temperature record cooling event between 1938 and 1977. The cessation of warming was caused by the Great Depression, WWII and the ensuing massive industrialization both for the war and after the war. First, the Great Depression decreased emissions which decreased warming. Then, aerosols and smoke from the building and detonation of weapons and from the fires of war created a cooling blanket of smoke (aerosols) that wrapped the earth. After the war, aerosols emitted from smokestacks, machinery and the industrial machine feeding post-war prosperity continued the creation of the veil of smoke (smog) that cooled the earth. Finally we realized we were poisoning ourselves through our atmosphere and enacted air pollution laws in the developed nations in the 1970s which put an end to the missions of cooling pollutants from the industrial machine.
This massive melt event has even made the news like the extraordinary climate change event that it is, only there is a problem with the reporting. This problem is widespread and pervasive and it is not just a problem with the media, it’s a problem with some climate scientists too, or at least their press release writers. The problem is that we (this is the royal “we”) are still treating these extraordinary events as a part of our old climate. In this case, this event is being reported as being similar to events that have happened about every 150 years over the last 10,000 years in Greenland, the last one in 1889. This is a nice safe comparison for a scientist, and just in case… it always ends with “we can’t say for sure.” The implication is that it has happened before so there is nothing unusual going on. We have the same challenge with a paper by Bjork et al in 2012 that talks about these episodic melts, he says the last one was in 1939.
It’s not that anything these good folks are saying is invalid. If our climate had not of already changed, what they say would be completely valid. Unfortunately, our climate has changed. Extreme weather events are happening much more frequently now than during our past climate of the 20th century. High temperature records are now being set twice as fast as low temperature records and we are just getting started with the warming. So comparing this recent extraordinary melt, part of a series of melt events that started in 1995, to the rest of the 20th century, just ain’t right.
We simply cannot compare what is happening now to anything in the past. Comparing now, or back then, to the future, when the extremes will be even more extreme and more frequent, is even more inappropriate.
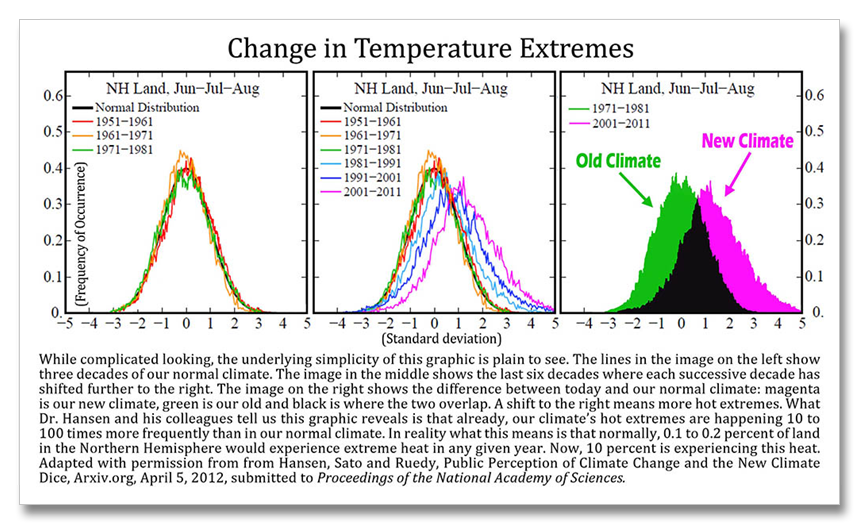
James Hansen, Director of the NASA Goddard Institute for Space Studies, the United States’ main government climate modeling agency, tells us that these kind of events are so prevalent in our newly changed climate that statistically it is much more likely that they are caused by climate change instead of the other way around. Hansen looked at temperature departure from normal in his most recent paper Perception of Climate Change, PNAS, August 2012 (see the graphic “Change in Temperature Extremes”). The green and magenta image is the one that most blatantly tells the story. When I realized how imposing an image I could create by coloring in the decade of the 50s and the decade of the 2000s to show the great departure of our climate today from our normal climate, I immediately asked Dr. Hansen if I could “color” in his figure. With his permission I present this eye-popper “Change in Temperature Extremes.”
The green is our old climate, represented by the decade of 1951 to 1961. The magenta is our new climate showing the decade 2001 to 2011 and it is shifted far to the warm side. What Dr. Hansen and his colleagues tell us this graphic reveals is that already, the hot extremes in the Northern Hemisphere are happening 10 to 100 times more frequently than in our normal climate. Normally, 0.1 to 0.2 percent of land in the Northern Hemisphere would experience extreme heat in any given year. Now, 10 percent is experiencing this heat every year, or 10 to 100 times more.
Even more telling though is the shift in the averages. Each decade since 1971 has been warmer than the last and looking closely, one can see the shift is increasing in size. In other words, warming is accelerating non-linearly. It’s like a Saturn V rocket taking off–ever so slowly at first.
This is much more serious than it appears to most. A few more heat waves are only a curiosity to most of us. We shuffle from the office to the car to the house in one swift air conditioned ballet. We don’t sweat except for 50 minutes every week when we mow the yard. We simply bill-pay more for the extra electricity to keep our homes the same temperature all the time. And each dollar we pay sends more greenhouse gases into the sky to warm us more so that we can use even more energy to keep our homes comfortable.
But ask the corn farmers in the Midwest about once a century heat waves. Then tell them they are going to have one of these every three to five years starting this year as Diffenbaugh and Ashfaq tell us in Intensification of hot extremes in the United States, in Geophysical Research Letters, 2010 (see entry for July 8, 2010). Then tell them that these two scholars from Stanford and Purdue tell us that beginning in 2020 we will see Dust Bowl drought 3 to 4 times per decade across most of the country. Then, by the time their kids are taking over the plowing, will see a heat wave like the one they had this summer that comes around every other year. To have a major crop failure caused by major drought once every 50 years is normal, maybe even once a generation. But every three years? Starting in ten years? or every other year while we are still alive? This will create global catastrophe. When it gets so hot that that the crops fail time after time, how do we go on?
In Austin last year it was so hot and dry that trees started dying across the region. the Texas Forest Service estimated that 500 million trees were killed. Across the American West trees are dying at quadruple the rate of the 1960s, and in the boreal forest of Canada natural tree mortality has increased ten-fold (1,000%). Neither of these studies took wildfires or the great pine beetle pandemic into consideration nor any of the other dozens of heat inspired insect infestations and disease outbreaks of the last decade or two. What happens in twenty years when most of the old trees are dead?
Beginning in just twenty years we will have an extreme 100-year heat wave every one to three years. How hot will the hottest heat waves in twenty years be? In other words, the drought of the century, the all-time record high temperature, will happen about every other year, not every 100 years. Every five years we will have a drought that is worse. Ever ten years, we will have a drought worse than the one every five years and every twenty years–same smell. It goes on and on and never stops.
Ganguly et al 2009, tell us that because we are on the worst-case scenario emissions path according to the 2007 IPCC and can expect 14.4 degrees of warming over land by 2050 (see entry for July 13, 2012). What you say? You thought it was only 2 to 3 degrees C of warming by 2100? Not any more. The 2 to 3 degrees C of warming was the story for the last twenty years. This was the Kyoto story. The Kyoto path was what we were sold on if we began to reduce emissions according to the Kyoto protocol. If we did as the climate scientists suggested, we would limit warming to less than the dangerous 2 degrees C threshold.
Now the Climate Change Generation has arrived, and the leaders of their parents did not do as the climate scientists suggested. Things are different now because of this. Our climate has changed. Now we will see 14.4 degrees F of warming over land. But this is not new science, it is the worst-case scenario of the old 2007 IPCC. We did not reduce emissions like we were told was prudent by some of the smartest people in the world and now we pay. Fixing climate pollution will be harder and the risks of really bad things happening before we get the problem under control are much greater.
For twenty years we have assumed we were going to deal with our ongoing greenhouse gas emissions and dangerous climate change would be held at bay. The path that we thought we were on was the middle of the road emissions scenario called A1B. This scenario included an equal mix of fossil fuels and alternative energy. No specific greenhouse gas emissions reductions were included in any of the emissions scenarios, but because A1B had an equal mix of fossil fuels and alternative energy, emissions were such that dangerous climate change would be averted.
But that was then and then is not now. We did nothing (or virtually nothing) to limit greenhouse gas emissions, to diversify our mix of energy sources, to increase energy efficiency and bring third world agriculture into the latter part of the 20th century. Now dangerous climate change is here. Extremely dangerous climate change is right around the corner.
Two researchers from the Universities of Manchester and East Anglia (Anderson and Bows) published a paper in the oldest scientific journal in world, the Philosophical Transactions of the Royal Society (1665), about the current state of our climate relative to how we thought our climate was. They tell us that because emissions are so much greater today than they should have been under the vision for the A1B scenario, climate change impacts are now much greater than they should have been at this time. In their words: “There is now little to no chance of maintaining the global mean surface temperature at or below 2 degrees C. Moreover, the impacts associated with 2 degrees C have been revised upwards, sufficiently so that 2 degrees C now more appropriately represents the threshold between ‘dangerous’ and ‘extremely dangerous’ climate change.” The authors even ask if 1 degree C should now be considered the threshold for simple “dangerous” climate change.
What this all means is that we are now on the worst-case scenario emissions path as imagined by the IPCC. Ganguly et al 2009 tells us: “Recent observations of global-average emissions show higher trajectories than the worst-case A1FI scenario reported in IPCC AR4.” What these authors from Oakridge National Labs, Notre Dame and the Center for Atmospheric research tell us is that in Austin we will see our average August temperature skyrocket to somewhere around 100 degrees in just 38 years (see entry for June 13, 2012). The Sonoran Desert Research Station in Arizona, the one with the giant saguaro cactus, averages only 98 degrees in August.
So in Austin in August in 2050, the average high temperature will be hotter than it is in the heart of the Arizona desert during the 20th century. During heat waves on our new hotter planet, it will not just be 6 degrees warmer than average like it was in our unprecedented heat wave in Austin last year, it will be much hotter. At least this is what the models say and they have been pretty much on the mark so far. The heat waves in the future will be even bigger and badder. So if the average Austin August temperature in 2050 is 100 degrees, figure an average August temp of 106 to 110 during heat waves. The average high temperature will be 10 or 15 degrees warmer than this, or 120 to 125 degrees. (You notice I am adding everything to the high end of the range. This is because our emissions are on the worst-case scenario emissions path and there is so little time to make an impact with the mindset of our society today. See my article on the RagBlog about this topic http://theragblog.blogspot.com/2012/08/bruce-melton-biggest-misunderstanding.html )
Hotter yet: Heat waves have spikes in temperature. The hottest day is about 5 degrees warmer than the average heat wave high temperature. This puts us, in just 38 years when most of us are still alive, around 130 degrees (plus a little for the heat island effect) for an all-time record high. The hottest temperature ever recorded on Earth was in Libya at 136 degrees. In Death Valley it was 134 degrees.
By 2020, the average temperature in Austin in August will be exactly like it was last year when we had 90 days of 100 degree or hotter heat.
Look at the graphic titled “Tedesco et al, Satellite Melt Extremes 1979-2008” in the graphic above “Greenland Melts-It’s Not About the Past.” There have been three extreme melt pulses since 1995, each one more extreme than the next. These have been punctuated by eight much smaller melt pulses that have each been larger than any melt event in the record.
Our climate change future is not about our climate past. You have seen the projections. You have seen the graphs of warming where the temperature line shoots up into blank space like a rocket. Look at the graphs under “Greenland Melts.” Tedesco has a really short record, but the base of the rocket launch is now visible.
Frauenfeld et al., shows the base of the rocket ramp as well. But in Frauenfeld, the base of the rocket ramp looks like the warming period from 1880 to 1930. And remember, the cooling spell in Greenland from 1938 to 1977 is identical to the cooling spell in the temperature record. More accurately, it’s a cessation of warming in the temperature record, but both events were caused by The Great Depression, WWII and wartime and post-war industrialization. The cooling was caused by pollution and it disappeared with pollution control laws passed in the 1970s.
How do we know that this time is different?
Among dozens of different and very robust findings about our changing climate, climate scientists have been telling us for twenty years that if we did not begin to immediately reduce emissions this would happen. We did not and it did. Now the warnings are more dire. The risks now are classified as “extremely dangerous climate change,” not just “dangerous climate change.”
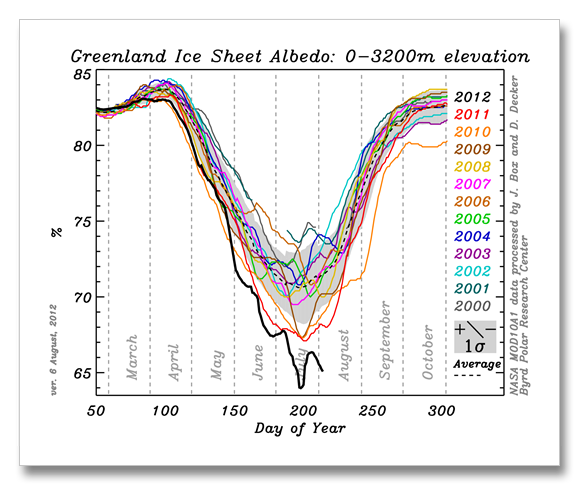
On to albedo. An ice sheet survives based on albedo. Albedo is whiteness or reflectivity, meaning the whiter something is the more sunlight it reflects. Because absorbed sunlight is what turns into heat, reflected sunlight carries its heat harmlessly back into space. This is one of the reasons why the northland and ice sheets are so darned cold. There is nothing up there to heat up for a large portion of the year because everything is covered by snow and ice.
As it warms, snow changes, even if it is below freezing. Warming creates larger ice crystals that have a lower albedo (reflect less). These changes in the snow crystals make the snow less white, or less reflective, so warmer snow is able to absorb more sunlight which changes to heat as it is absorbed. This is called the ice albedo feedback. A little bit of extra warming means a lot of extra melt.
Albedo of the Greenland Ice Sheet is at an all time high this year as seen in the graphic “Greenland Ice Sheet Albedo.” As the snow begins to melt, the wet snow has an even lower albedo increasing the melt further as even more heat is absorbed. Once all of the snow has melted off of the ice sheet, all that remains is the ancient solid solidified ice (compressed snow). Its albedo is even lower than that of wet snow.
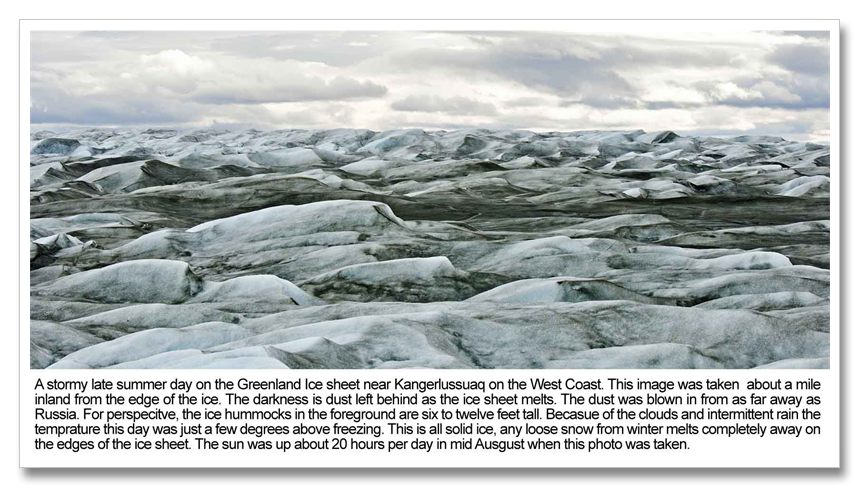
The meltwater leaves behind a lot of the dust that has been accumulating for eons on the ice sheet. Yes, even the ice sheet collects dust and the amount is amazing. Dust has a much lower albedo than ice or snow so it absorbs much more heat, melting even more ice. Not only is it visible in places where melt has been high recently, but scientists use ice sheet dust to date ice. Colder times are drier and windier, and they create dustier snow layers. And surprisingly most of the dust on the Greenland ice sheet comes from Siberia.
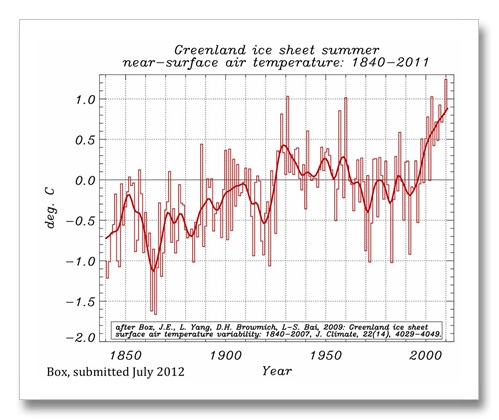
Jason Box is a professor at the Ohio State University Byrd Polar Research Center. He has made 23 expeditions to Greenland since 1994 and his time camping on the inland ice exceeds 1 year. He has authored or co-authored 53 peer-reviewed publications related to cryosphere-climate interactions and was a contributing author to the Nobel Peace Prize-winning Intergovernmental Panel on Climate Change 2007 4th Assessment Report. In a submitted paper, Professor Box has updated his 2009 Journal of Climate publication “Greenland Ice Sheet Surface Temperature Variability: 1840 to 2007.” The 2009 paper draws on weather data in Greenland from the late 1700s, but the really interesting part is the additional 4 years of data (to 2011) in his new paper.
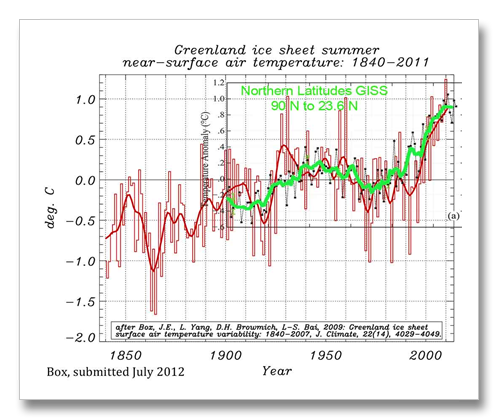
Box tells us on his blog Meltfactor.org: “It seems little doubt that recent summer air temperatures for Greenland ice are the highest in at least 172 years. Summer temperatures in the late 2000s are roughly 0.5 C warmer than in the 1930s and even warmer than at any time since at least the 1840s. Because the reconstruction captures the end of the Little Ice Age, it is further reasonable to think that Greenland probably hasn’t been as warm in summer than since the time the Norse colonized Greenland beginning in 982.” The graphic from Box’s submitted paper showing the latest four years of warming and it shows an all too familiar pattern. (See the graphic: Greenland ice sheet summer near surface air temperature 1840 to 2011.)
Look at how much warmer it has been since 1889, and specifically the last decade. (The baseline of 0 is arbitrary.) The coldest place in Greenland is Summit, a research station at the top of the 10,552 foot high Greenland Ice Sheet, 415 miles north of the Arctic Circle. Between 2000 and 2011, the temperature at Summit had risen above the freezing mark four times. But in mid-July 2012, temperatures eclipsed the freezing mark on five days, including four days in a row from July 11 – 14 at 34 to 36 degrees F.
Compare this to the average Northern Hemisphere temperature from GISS in the image below in chartreuse. Isn’t that fit remarkable?! And remember, the massive 97 percent melt this July is not included in this record!
Now let’s take a look at just a few of the unprecedented weather patters this year. Jeff Masters, Chief Meteorologist at the Weather Underground tells us about record early snow melt in the Austrian Alps: “One of the longest meteorological data records at high altitude comes from Sonnblick, Austria, on a mountaintop in the Alps with an elevation of 3106 meters (10,200 feet.) The observatory typically sees maximum snow depths of 3 – 4 meters (10 – 13 feet) during winter. According to weather records … the snow had never completely melted at Sonnblick until the summer of 1992. Complete snow melt did not happen again until August 12, 2003, and has happened an average of once every two years since then–but always in September. Yesterday, on July 31, the snow completely melted at Sonnblick, the earliest melting since record keeping began in 1886. It’s been an exceptionally hot summer in Austria, which experienced its 6th warmest June since record keeping began in 1767. Sonnblick Observatory recorded its all-time warmest temperature of 15.3°C (60°F) on June 30. Vienna hit 37.7°C (100°F) that day–the hottest temperature ever measured in June in Austria. Note that the two mountains in the Alps with long climate records, Saentis in Switzerland and Zugspitze in Germany, beat their records for earliest melting last year in 2011 (Saentis beat the previous record of 2003, and Zugspitze tied the record set in 2003.)”
The myths are starting to fall. America’s awareness of climate change issues is on the increase once again. For almost a decade during the Bush Administration, we were given permission to ignore. When former president George W. Bush reneged on his campaign promise to enact Cap and Trade, and then announced that the U.S. would not be ratifying the Kyoto Protocol, the playing field was set. Awareness plummeted. But the last five or six years of extreme and unprecedented weather events have demanded our attention. Beginning two to three years ago, awareness began to rise again. And now the myths are beginning to fall in a big way.
Dr. Richard Muller: The Berkeley Earth Surface Temperature (BEST) group is that Koch Brothers consultant hired last a couple of years ago to debunk the global temperature record. The Koch Brothers thought they had a sure thing because Muller has been a long-time outspoken skeptic of the global temperature record. Dr. Muller wrote an op-ed in the New York Times last Sunday. The piece started off:
Call me a converted skeptic. Three years ago I identified problems in previous climate studies that, in my mind, threw doubt on the very existence of global warming. Last year, following an intensive research effort involving a dozen scientists, I concluded that global warming was real and that the prior estimates of the rate of warming were correct. I’m now going a step further: Humans are almost entirely the cause.
The Charles G. Koch Foundation gave $150,000 to the Berkeley Earth Surface Temperature (BEST) study in 2011. Two years ago, a Greenpeace report, Koch Industries, Secretly Funding the Climate Denial Machine (2010) found that the Koch brothers outspent Exxon Mobile in science disinformation at a whopping $48.5 million since 1997. Updated on June 20 2012, since 1997 the billionaire oil brothers Charles and David Koch have contributed $61.3 million to the climate change denial machine.
So, why are we talking about these weather events from our old climate. Because the Koch brothers and others like them assure us that these recent extreme events are no different? Not at all.
Well maybe this is part of it. But they tell us this because is intuitive to us to start with. It makes sense. When we talk about weather we always talk about this storm or that, or this cold snap or that summer heat wave, or the flood back in the day, the blizzard, the hurricane. Our time is punctuated by extreme weather. Our lives are lived in comparing our most recent weather event to something like it in the past.
But now our climate has changed. Weather patterns are different. Extremes of yesteryear are much more common today. A new class of super extremes has taken the place of the old extremes. We can no longer compare the old patterns to today.
This 150 year melt event spoken of so frequently in the media in stories about the recent Greenland melt is an excellent example. This is an event that happens basically once every 150 years. The last time it happened was in 1889 and this time is right on schedule. In reality those ancient melt events occurred from 80 to 300 years apart and it’s only the average time period that is 150 years. But things are different now.
What Hansen tells us, is that the extremes are now happening 10 to 100 times more frequently. This means that this 150 year melt event is now a 15 year event or even an every other year melt event. So the rare events, that in our normal climate happened once in 150 years now happens in our changed climate once in 15 years to once every other year. and this is well seen in Tedesco’s work where 13 out of the last 17 years have seen more melt in Greenland than the entire rest of the record back to 1979.
Our climate has changed significantly already and we are just getting started with the changes. But it is going to be easy to fix this thing if we just get started. I talk a lot about the famous ice scientists Richard Alley and his climate pollution solution analogy from his book Earth: The Operators’ Manual. He tells us that nearly 100 economic evaluations of the solutions are focusing on 1 percent of global GDP as the costs of the solutions.
The finest thing about what Dr. Alley tells us though is that 1 percent of GDP is the same amount we have spent every year for the last 100 years on clean drinking water across the planet. The solutions use existing technologies and as is almost always the case, once industry learns that there is money to be made removing carbon from our atmosphere, costs will plummet. In the meantime, tipping points, thresholds, irreversible changes and abrupt changes are the threat.
The problem is, we have a really tough time modeling those abrupt changes, thresholds and tipping points. Now don’t get the wrong idea, climate modeling on the whole has been quite accurate for thirty years. There’s a myth out there, promoted by the denying and delaying crowd (D&D crowd), that climate models are no better than weather models. It follows the logic that if weather models can’t get the five-day forecast correct, what do we expect from climate models? This propaganda, besides being embarrassingly wrong, enhances one of our inappropriate societal beliefs about the weather and climate.
Let me ‘splain Lucy:
The broad understanding that the public has about climate models is that they can somehow be compared with weather forecasting models. The resulting mental leap allows us to think that, like weather models, climate models cannot forecast their way out of a wet paper bag. Much of this myth comes from the D&D gangs’ twisting of a real fact, but much of it also comes from the nightly television weather forecast. Weather models have been used for decades. We know they only get the first few to several days correct. Because there is so little real distinction between the weather and climate in the public’s mind, the connection sticks.
Let me repeat something. Climate models have been remarkably accurate and consistent for thirty years—even the old simple models. That the models do not reflect, even attempt to model those difficult abrupt changes is not important to the propagandamaster. They take these little facts and twist them out of context to create a reality that is completely false. So then, how are climate models so much better than weather models? let me explain this by explaining the difference between how meteorologists make the seven day forecast and how climate scientists project our climate 100 years into the future.
Meteorologists load up all of the current weather data from across the planet or a continental region into their weather models and then they run them into the future for a week or two. The results are, as you and I know, quite variable after three to five days.
Climate modelers do something entirely different. The do not load the models up with the current weather conditions. They start with any old typical batch of weather data and run the model. Then they blindly change the weather data in the model to represent any other typical weather from that same time frame. Like on May 30th in Chicago it might be 88 degrees and sunny; another May 30th might be 67 degrees and rainy, another might be 79 degrees and partly cloudy. They make up dozens and scores of these simulations and run them all off into the future. They start their climate models hundreds and even thousands of years in the past and run them hundreds and hundreds of years into the future. Backing up the clock to some ancient time in the past helps confirm the models as they recreate our past climate inside the computer.
The climate modelers then have scores of results that, like the television weatherpersons’ seven-day outlooks, are all different. Of course all of the weathercaster’s models are not different, only the last few days of each are goofy, but you get the picture.
So what do the climate modelers do with all of these goofy forecasts based on imagined weather? They average them all together of course. This is what climate is. It’s the average weather. Climate is not about the specific conditions on any individual day. It’s not about what temperature it will be tomorrow, or how much it will rain tomorrow. That is called weather. It’s not climate.
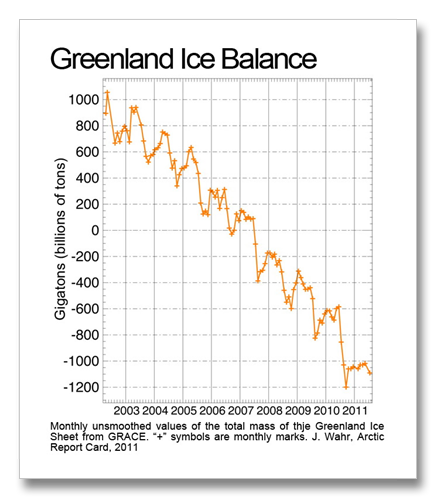
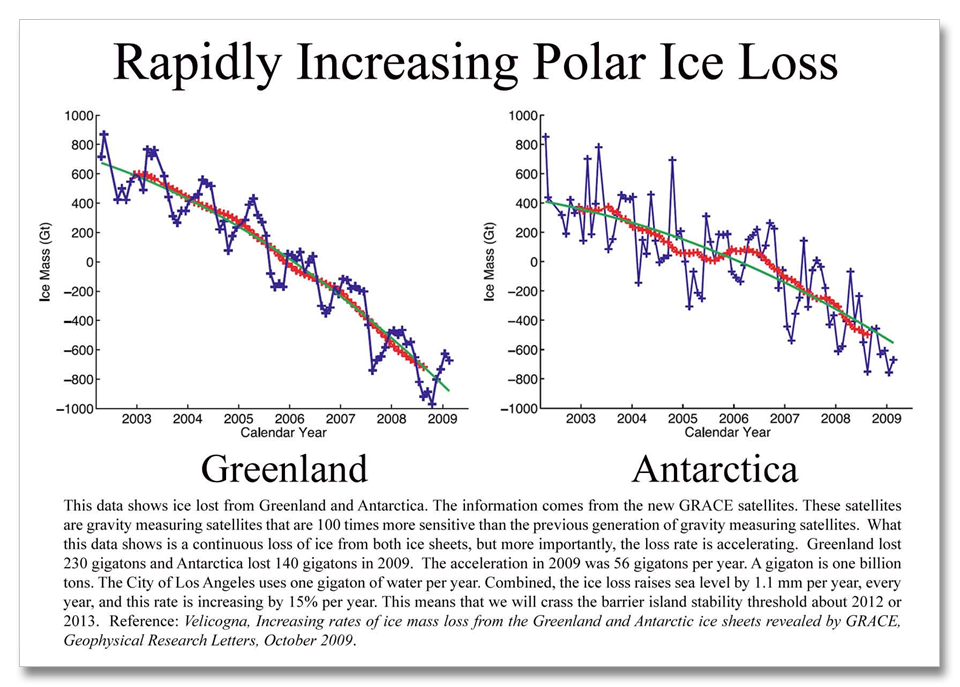
The disconcerting reality is that either the brevity of today’s reporting, or the complicated nature of climate change, or the propaganda supporting a message that the science is faulty, simply allows for an incomplete picture of the actual changes taking place and their implications. This challenge is not one solely found in the media. The NASA press release is typical. It tells us that Greenland is losing 150 gigatons of ice per year. What the reporter does not tell us is that research out of the University of California and the Jet Propulsion Lab at the California Institute of Technology has found that Greenland melt and ice discharge increased to 286 gigatons in 2009 (Velicogna 2009), or that NASA’s international Arctic Report Card, put together by 121 scientists from 14 different countries, tells us the 2010 Greenland ice loss increased to 430 gigatons. This information comes from the new gravity measuring satellites called GRACE (also from NASA) that are 100 times more accurate than the previous gravity measuring satellites.
Why did this press release writer make the remarks he did about Greenland ice loss? I see this a lot. The press release writers are
in the public relations program. The are often not scientists. The complaints about these PR folks ability to comprehend and write about science are endless. I was even recently asked by a professor from one of the worlds top universities if I would consider freelancing press release writing because of, I presume, similar experience(s).
Now a quick word about Antarctica and the general conservative nature of the climate science consensus. The 2007 IPCC report said that Antarctica was not supposed to start losing ice until after 2100. Yet from Velicogna 2009, and the graphic Rapidly Increasing Polar Ice Loss, Antarctica is not only losing ice, but it has caught up with Greenland–already! How can this be? The reason the IPCC is so far off, is the rate that our climate is actually changing today and the IPCC process. The rate has sped up a lot, but the IPCC is a significantly dated voice. They stopped taking papers for their 2007 report in 2005. The academic work in those 2005 reports was done prior to 2003, so the IPCC 2007 report is a decade old. A lot of science has gone under the bridge in ten years.
This is an extremely big deal and the media, and many climate scientists simply tell us that we cannot blame any one event on climate change as if this was still the 20th century. What is probably happening is that, like climate scientists have been warning us for twenty years, if we did not significantly reduce greenhouse gas emissions we would cross a climate change threshold where all of the sudden our climate would begin to change much more rapidly than before.
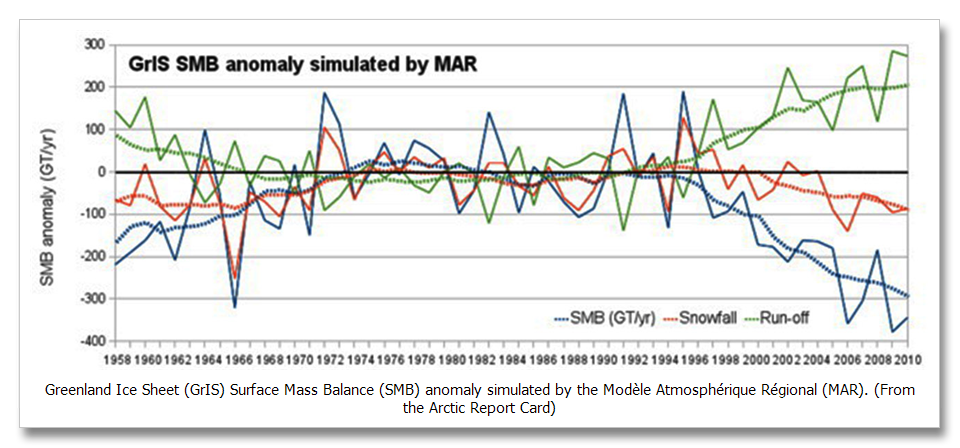
This graph below from the Arctic Report Card shows this little threshold we have probably crossed. The red is snow accumulation in Greenland, the green is melt runoff and the blue is surface mass balance (SMB). SMB also diverged from snowfall and melt pre-1970. But pre-1970, we had yet to begin to see substantial impacts from climate change around the globe. This is the crux of our situation.
Now we have started down the path of increasing impacts due to climate change. This is no longer a simple natural climate variation. It will not swing back to normal. We are increasing the carbon dioxide concentration of our atmosphere 14,000 times faster than anything normal in the last 610,000 years. We are on the worst-case scenario emissions path of the 2007 IPCC process, not the middle of the road scenario like we have been told for twenty years. Things are happening much faster than projected. The have accelerated because we did not begin to reduce emissions 20 years ago like was suggested prudent by some of the smartest people in the world.
To avoid dangerous climate change we were supposed to have reduced emissions to 7 percent below 1990 levels by this year–2012–under the Kyoto Protocol. The U.S., Afghanistan and South Sudan were the only countries in the world to not ratify Kyoto. Since 1990 we have not only not reduced emissions, we are now emitting 50 percent more than we did in 1990. As we have been told by climate scientists for nearly two decades now, the longer we delay, the faster and more extreme will be the changes.
What is happening in Greenland now is anything but a normal cycle. It is climate change pure and simple. It is very likely the beginning of an abrupt climate change. If this were to have happened ten years ago, maybe we could rely on that old maxim “we cannot blame any one weather event on climate change.” But today is not ten years ago. And this is not one weather event.
In an interview with the Guardian, Box said; “This is now the seventh summer in a row with this pattern of warm air being lifted up onto the ice sheet on the summer months,” he said. “What is surprising is just how persistent this circulation anomaly is. Here it is back again for the seventh year in a row in the summer bringing hot, warm air onto the ice sheet.” On his blog on the 15th of August he had this comment about the current extreme Greenland melt: “…is due to extensive increased melting occurring all over Greenland, especially at high elevations where melting lasted up to 50-60 days longer than the average. This means that some of the areas at high elevations in south Greenland are generally subject to a few days of melting (if it happens at all) and this year they underwent melting for more than 2 months (so far).”
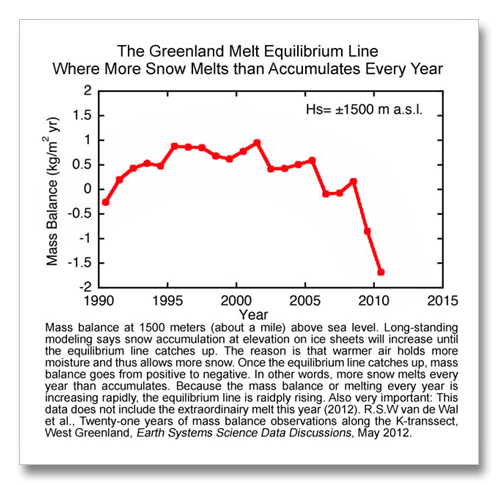
Looking at the “Greenland Melt Equilibrium Line” graphic we can see another aspect of how the abrupt climate change has begun. Jason Box’s work about how much faster Greenland is melting and James Hansen’s work about how much more extreme heat events have become are both conservative. As-in, climate change is even worse than what these two researchers say.
They tell us that their work evaluates the average for the period 2000 to 2010. Things have steadily become warmer over this ten year period so the average reflects sometime around 2005, not 2010. The years 2011 and 2012 were both more extreme in Greenland than 2010. The melting feedback has begun.
Review: The past is not now. Our climate has changed already and will continue to change faster in the future for time frames that matter. Extreme heat events that, in our 20th century climate happened across 0.1 to 0.2 percent of Earth’s land surface, are now happening (2000 to 2010 average) across 10 percent of Earth’s land surface. Comparing today to the past, at any point in the past, is scientifically inappropriate.
The last thing I want to leave behind is another inappropriate thing that a lot of climate scientists are saying trying to stay on the conservative side of things. They say “if we see this happening again soon…” last year they said it with the big drought and heat wave across the south central United States, and guess what happened this year? They are saying the same thing again about the unprecedented drought in the Midwest and they are saying it about Greenland too. All this spurious discussion leaves a false and dangerous sense of normalcy.
There are also scientist out there who are thinking out of their cubicles. There is acknowledgement that melt in Greenland is speeding up ice flow and that something in our ancient past has happened that they call dynamical ice sheet disintegration (DISD). But the facts around dynamical ice sheet disintegration are few and the IPCC makes a concerted effort to tell us that their report in no way includes any possible impacts from DISD.
Now we have acknowledgement that meltwater in Greenland could do something unexpected. We have already seen how increased meltwater is causing icequakes 1,000 time more powerful than anything ever recorded before (5.4 Richter scale). And we have seen how melt water can penetrate to the bottom of the ice sheet and lubricate ice sheet flow. This is one of the ways that these gargantuan icequakes occur. Areas of the ice sheet miles across can slip and when they stop the icequake occurs.
When I was in Ilulissat Greenland several scientists were at the Hvide Faulk Hotel waiting for the weather to clear so they could catch helicopter ride up to Swiss Camp on the ice sheet. Dr. Russell Huff, then of the Cooperative Institute for Environmental Science (CIRES) told me that meltwater draining into crevasses to the bottom of the ice sheet can even accumulate to a depth that causes the entire ice sheet, up to 4,000 feet thick, to float six to eighteen inches off bedrock.
It appears now that the cryologists (ice scientists) are concerned. As we continue to warm the Arctic rapidly, these melt events will obviously increase rapidly. We have seen average temperature in Greenland change 20 to 30 degrees F in the past 100,000 years, maybe a dozen or more times. Today however we are pushing our climate much more dramatically than has been the case in the past. So much more that our CO2 concentration is likely increasing as fast as any time since the giant asteroid struck the Yucatan Peninsula and the dinosaurs went extinct 65 million years ago (Zeebe and Caldeira 2008–14,000 times faster).
Past Greenland melt, when these icequakes started happening, was on average 20 to 30 percent of the ice sheet. By 2011 this melt had increased dramatically to 60 to 70 percent of the ice sheet and now we have this amazing new record. Warming coming over then next 20 to 40 years will be ten times more than we have seen across the globe already. Melt will not increase linearly; remember the ice albedo feedback.
Now, this is scary enough, but there is an important piece of physics that needs to be understood about ice melting. It takes 9 time more energy to raise the temperature of ice from a frozen 31 degrees to the melting point of 32 degrees than it does to raise it from a frozen 30 degrees to a frozen 31 degrees. The reason is called the heat of fusion and it is responsible for turning a liquid substance into a solid one or vice versa. We have been putting more and more heat into the Greenland Ice sheet for a couple of decades or more now, and it is starting to respond. The ice is getting warmer. Much less heat is now required to cross the threshold from 32 to 33 degrees.
It is so manifestly true that climate change has begun and that this melt in Greenland, along with all of the other unprecedentedly extreme weather events lately, are caused by climate change. The quantity of melt will increase rapidly from here on. This could mean unexpected things for the relationship between the ice sheet and the lubrication of meltwater that finds its way to bedrock through crevasses. And if climate change so far is any indicator, we should expect the unexpected, and we should expect it sooner rather than later.
References:
The edge of the ice sheet has been satble or 100 years or more: Foreman et al., Little Ice Age and neoglacial landforms at the Inland Ice
margin, Isunguata Sermia, Kangerlussuaq, west
Greenland, Boreas, January 2007.
A recent article in the journal Science, tells us that that most of the ice loss happened in two periods – 1985-1993 and 2005-10 – with relative stability in between. doesn’t mean much in the long term picture, rare, Episodic melt 1930s: Bjork, An aerial view of 80 years of climate-related glacier fluctuations in southeast Greenland, Nature Geoscience, May 2012.
http://www.nature.com/ngeo/journal/vaop/ncurrent/full/ngeo1481.html
Extremes are happening 10 to 100 times more often: Hansen, Sato and Ruedy, Public Perception of Climate Change and the New Climate Dice, Arxiv.org April 5, 2012, submitted PNAS. http://arxiv.org/ftp/arxiv/papers/1204/1204.1286.pdf
Hansen, Sato and Ruedy, Perception of Climate Change, PNAS, August 2012.
http://www.pnas.org/content/early/2012/07/30/1205276109.full.pdf+html
Dust Bowl Drought 3 to 5 times per decade beginning in 2030: Diffenbaugh and Ashfaq, Intensification of hot extremes in the United States, Geophysical Research Letters, July 2010. (link)
Tree mortality in the Western U.S. quadrupled since 1960s: Mantgem et al. Widespread Increase of Tree Mortality Rates in the Western United States, Science, Jan 2009.
http://www.fs.fed.us/rm/pubs_other/rmrs_2009_van_mantgem_p001.pdf
Ten-fold increase (1000%) in tree mortality in the Canadian West since 1960: Peng et al., A drought induced pervasive increase in tree mortality across Canada’s boreal forests, Nature Climate Change, December 2011.
http://www.nature.com/nclimate/journal/v1/n9/pdf/nclimate1293.pdf?WT.ec_id=NCLIMATE-201112
Extremely Dangerous Climate Change 1 degrees C not 2 degrees C: Anderson and Bows, Beyond dangerous climate change: Emission scenarios for a new world, Philosophical Transactions of the Royal Society, January 13, 2011.
http://rsta.royalsocietypublishing.org/content/369/1934/20.full.pdf+html
14.4 degrees F of warming on land by 2050: Ganguly et al., Higher trends but larger uncertainty and geographic variability in 21st century temperature and heat waves, PNAS, September 2009.
http://www.pnas.org/content/106/37/15555.full
Austin’s average August temperature be 100 degrees in 2050 based on the 2007 IPCC worst-case scenario path that we are now upon: Ganguly et al., Higher trends but larger uncertainty and geographic variability in 21st century temperature and heat waves, PNAS, September 2009. http://www.pnas.org/content/106/37/15555.full
Jason Box’s Meltfactor: http://www.meltfactor.org/blog/?page_id=9, July 25, 2012
Box et al., Greenland Ice Sheet Surface Temperature Variability 1840 to 2007, American Meteorological Society, Journal of Climate, July 2009. http://journals.ametsoc.org/doi/pdf/10.1175/2009JCLI2816.1
Jeff Masters: http://www.wunderground.com/blog/JeffMasters/comment.html?entrynum=2160
Dr. Richard Muller: The Berkeley Earth Surface Temperature (BEST) Group, http://berkeleyearth.org
Greenland Melt 97 Percent: NASA Jet Propulsion Lab Press Release: http://www.nasa.gov/topics/earth/features/greenland-melt.html
Arctic Report Card 2011: Greenland Mass Balance (NASA): Richter-Menge, J., M. O. Jeffries and J. E. Overland, Eds., 2011, http://www.arctic.noaa.gov/reportcard.
http://www.arctic.noaa.gov/reportcard/greenland_ice_sheet.html The material presented in this Report Card was prepared by an international team of 121 scientists from 14 different countries, assisted by section coordinators and the editorial team. The Circumpolar Biodiversity Monitoring Program (CBMP) of the Arctic Council Conservation of Arctic Flora and Fauna (CAFF) Working Group contributed material on biodiversity. Independent peer-review of the 2011 Report Card was organized by the Arctic Monitoring and Assessment Programme of the Arctic Council.
Rapidly Increasing Polar Ice Loss: Velicogna, Increasing rates of ice mass loss from the Greenland and Antarctic ice sheets revealed by GRACE, Geophysical Research Letters, October 2009. (link)
Antarctica not supposed to begin losing ice until 2100: Intergovernmental Panel on Climate Change, Fourth Assessment Report, Climate Change 2001: Climate Change 2007: Working Group I: The Physical Science Basis, 10.6.5 Projections of Global Average Sea Level Change for the 21st Century, Table 10.7. Also see 10.6.4.1, Surface Mass Balance, “All studies for the 21st century project that Antarctic SMB changes will contribute negatively to sea level, owing to increasing accumulation exceeding any ablation increase.” Also see Executive Summary, Sea Level. http://www.grida.no/publications/other/ipcc_tar/
CO2 is changing 14,000 times faster than the long-term average for the last 610,000 million years: Zeebe and Caldeira, Close mass balance of long-term carbon fluxes from ice-core CO2 and ocean chemistry records, Nature Geoscience, Advance Online Publication, April 27, 2008. http://content.imamu.edu.sa/Scholars/it/net/zeebe_caldeira_2008.pdf
CO2 emissions are worse than the worst-case scenario developed by the IPCC: Synthesis Report, Climate Change, Global Risks, Challenges and Decisions, Climate Change Congress, International Alliance of Research Universities, University of Copenhagen, March 2009. http://climatecongress.ku.dk/pdf/synthesisreport
Raupach et al., Global and regional drivers of accelerating CO2 emissions, PNAS, April 2007.
http://www.pnas.org/content/104/24/10288.full.pdf+html
IPCC Special Report on Emissions Scenarios http://www.ipcc.ch/ipccreports/sres/emission/index.htm
Icequakes releasing 100,000 times more energy than anything before seen have started happening in Greenland… (Harvard), Tsai and Ekstrom, Analysis of Glacial Earthquakes, Journal of Geophysical Research, V112 April 2007.
http://www.agu.org/pubs/crossref/2007…/2006JF000596.shtml http://people.seas.harvard.edu/~vtsai/files/GlacialEarthquakesPreprint.pdf
Greenland melt Ice sheet float 6 inches: Jay Zwally interview — Program Two: Global Warming on Greenland & Risk of Gulf Stream Collapse http://old.globalpublicmedia.com/transcripts/458 Also a personal conversation with Dr. Russell Huff while awaiting a helicopter ride to Swiss Camp at the Hotel Hvide Faulk, Ilulissat, Greenland.
Guardian Article: http://www.guardian.co.uk/environment/2012/jul/24/greenland-ice-sheet-thaw-nasa
NASA Press Release: http://www.nasa.gov/topics/earth/features/greenland-melt.html
Press Release – City College of New York: http://www2.ccny.cuny.edu/advancement/news/Greenland-Melting-Breaks-Record-Four-Weeks-Before-Seasons-End.cfm
Professor Marco Tedesco’s Blog: http://www.greenlandmelting.com/

