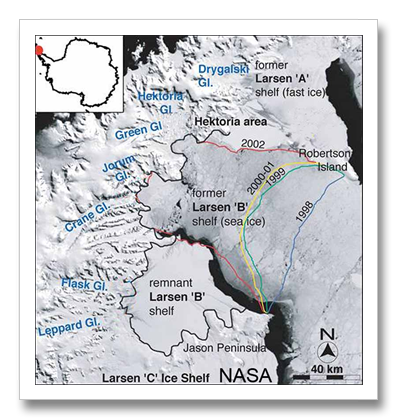
The National Snow and Ice Data Center has completed a big evaluation of the Larson Ice Shelf. You may remember the Larson B —
it collapsed in 2002 in a colossal way. An area the size of Rhode Island collapsed in about 30 days. The collapse was caused by increased meltmater draining onto the crevasses of the ice shelf. The increased melt water created a gravity wedge that drove the crevasses entirely through the ice shelf causing the spectacular collapse. the collapse could have been enhanced by melting beneath caused by warmer ocean waters.
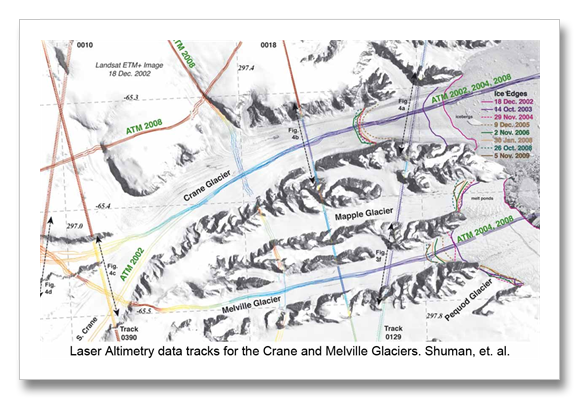
The ice shelf created a dam that held back the mountain glaciers feeding the Larson B. After the collapse the amount of ice dumping into the Arctic ocean from these feeder glaciers increased by up to 8 times. Sixteen years after the collapse of the Larsen A Ice Shelf, just north of the Larsen B, the outlet glaciers there are still showing elevation losses meaning that their discharge continues at an accelerated rate.
The latest evaluation of gravity satellite data for the period shows that ice loss has likely been two to three times greater than was previously understood. What we first understood to be losses of about 17 gigatons per year is now more like 41 gigatons per year. Since the Larsen B disintegration in 2002, the remaining smaller portions of the ice shelf continue to collapse. About half again as much has broken off of the remnants of the Larsen B Ice Shelf since 2002 as was initially involved in the Rhode Island sized collapse.
Elevation losses to the outlet glaciers for Larsen B have been as high as 500 feet since 2002.
National Snow and Ice Data Center Press Release: http://nsidc.org/news/press/20110725_iceshelf.html
Shuman, Berthier and Scambos, 2001 to 2009 elevation and mass loss in the Larsen A and B embayments, Antarctic Peninsula, Journal of Glaciology, July 2011. http://www.igsoc.org/journal/current/204/j10J164.pdf
Breakup of the Larsen B – NASA animation: http://earthobservatory.nasa.gov/IOTD/view.php?id=2288


