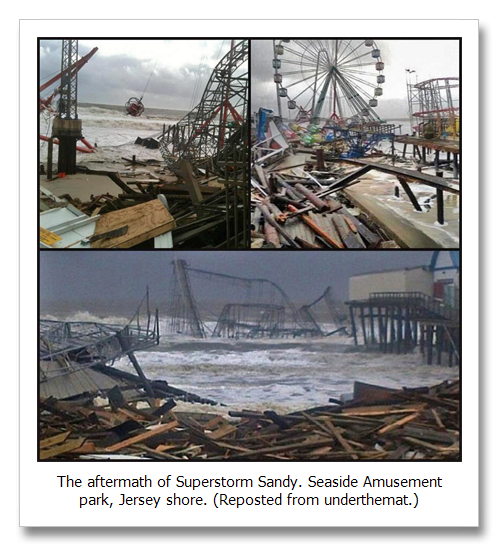
Research from last March tells us that Superstorm Sandy was directly caused by climate change.
I won’t bore you with more quotes from Governors Cuomo or Christie, or the latest “speculation” in the media about whether or not Superstorm Sandy was or was not “influenced” by climate change. I’ll not repeat the list of stunning storm facts that litter the broadcasts. But I will lay out the latest science from our best academic institutions about why extreme weather events these days are not only influenced by climate change—many of them are caused by climate change, including hurricane Sandy.
A paper from last March (2012) in the prestigious journal Geophysical Research Letters not only tells us about extreme weather events enhanced by warming, it tells us the origins of many of these unprecedented events can specifically be blamed on climate change. The paper is about what is called Arctic Amplification and how it enhances and even creates extreme weather far south in the mid-latitudes.
This phenomenon is about how global warming in the far north is enhancing or directly causing extreme weather because of the “albedo feedback.” In Latin, albedo means the amount of light reflected by an object. In the Arctic, the albedo feedback operates via snow and ice and is the reason why the Arctic has warmed on average twice what the rest of the planet has warmed.
Snow and ice reflect up to 90 percent of the sun’s light harmlessly back into space, where it does not warm the planet. Tundra, rock and ocean absorb up to 90 percent of sunlight, and in this process the light changes from light energy into heat and then largely stays here on the planet because of the greenhouse effect.
Snow and ice in high latitudes help keep the global refrigerator cold by not allowing sunlight to be changed into heat, but as the planet slowly warms that reflective covering melts a little sooner every year. A little more bare tundra, rock and ocean then allows for a little more heat to hang around every summer. This causes freeze up to happen a little later in the fall and melt to happen earlier in the spring. It’s a feedback loop like so many other things in climate change land. It feeds upon itself and grows stronger until all the snow and ice are gone.
This year’s massive sea ice melt record reveals the greatest amount of Arctic amplification that we have yet to see on this warming planet and things are starting to get crazy with this ongoing string of extreme and unprecedented weather events.
This is just the latest in a series of papers to evaluate the impacts of a warming Arctic on extreme weather in mid Northern Hemisphere latitudes and it is like all the rest. These authors from Rutgers and the University of Wisconsin have confirmed once again that a warming Arctic adds energy to the atmosphere and supercharges the jet stream kicking it further south. As it does so the general eastward travel trend of loops in the jet stream (that are the primary drivers of big weather systems) slows down and in some cases allows the jet stream to become stationary for a much longer time than when Earth was not as warm as it is today. This research looks at data since 1980 and finds the trend begins in earnest from about the turn of the century to 2005/7, depending on which season and which layer of the atmosphere they were looking at. Below are the important bits from this article’s summary:
Two effects are identified that each contribute to a slower eastward progression of Rossby waves [the jet stream] in the upper-level flow: 1) weakened zonal winds, and 2) increased wave amplitude [the great bends in the jet stream]. These effects are particularly evident in autumn and winter consistent with sea-ice loss, but are also apparent in summer, possibly related to earlier snow melt on high-latitude land. Slower progression of upper-level waves would cause associated weather patterns in mid-latitudes to be more persistent, which may lead to an increased probability of extreme weather events that result from prolonged conditions, such as drought, flooding, cold spells, and heat waves.
These researchers go on to basically describe why climate change caused extreme weather events are not just normal weather events enhanced by climate change, but the weather events themselves—from inception—are caused by climate change:
Individual extreme weather events typically have a dynamical origin. Many of these events result from persistent weather patterns, which are typically associated with blocking and high amplitude waves in the upper-level flow [jet stream]. Examples include the 2010 European and Russian heat waves, the 1993 Mississippi River floods, and freezing conditions in Florida during winter 2010–11.
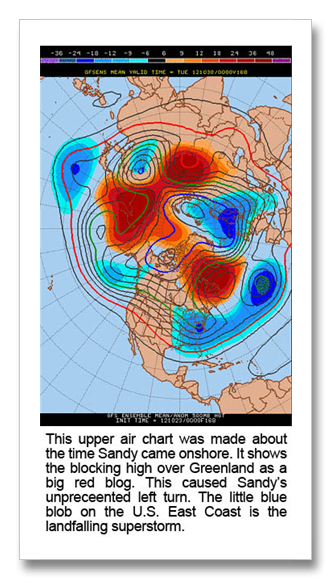
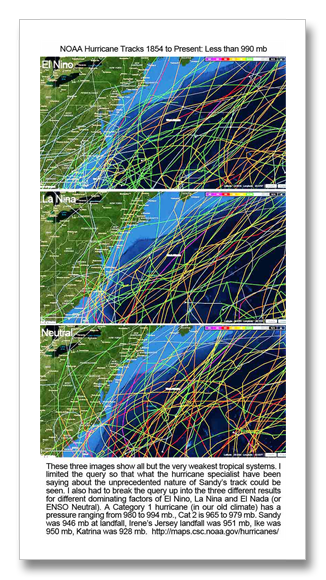
Sandy’s peculiar track and her hybridizing with a Nor’easter originated in the big blocking high pressure system that has been persistent over Greenland this autumn. You can see it in the red and blue pressure plot from about the time Sandy made landfall.(500 mb GFS ensemble for those of you who understand weather geek). The big red spot over Greenland is the blocking high. The little blue spot on the U.S. East Coast is the landfalling Superstorm Sandy. This is what caused our little superstorm to take that unprecedented left turn over Jersey. If it were not for that blocking high, Sandy would have followed the traditional path that every single hurricane ever tracked in the region has followed—it would have veered right, away from land out into the North Atlantic. NOAA’s hurricane paths are shown farther below to substantiate this large statement made by meteorologist.
For a hurricane to hybridize with a Nor’easter is not unheard of although it is rare. When they do this, like the most recent deadly example, the 1991 “Perfect Storm,” they do it along the shoreline or out in the Atlantic, then they follow the traditional storm track recurving farther out into the Atlantic. The big blocking high over Greenland, caused by the extra-warmth in the Arctic created by the twice-record smashing low Arctic sea ice melt this year, was what forced Sandy to move inland as it mated with the Nor’easter spawning this climate change superstorm.
Its extremeness was enhanced by an Atlantic ocean that was two to three degrees warmer than normal. Warmer water has more heat energy and heat energy is what fuels hurricanes. Not all warm seawater years can be associated with climate change—true, but to claim these recent warm sea water years as NOT caused by climate change, when we have been warned for decades that this would happen and when we have been warned that if we did not reduce emissions (we did not) that warming would proceed faster—is phenomenally irresponsible behavior.
Now there are a few myths out there that must be addressed for this discussion to succeed. It’s a travesty that this perceived debate exists. But it is what it is. To help you understand the problems with the talking points I need to discuss these things.
Some pretty smart fellers out there are telling us this storm was just another dangerous storm, that many, many storms have caused more damage. One of these also makes the observation that we have been in a hurricane drought for seven years as no Cat 3 hurricanes have hit the U.S. in this time. He said the last one was Wilma in 2005 and that this is the longest such span in a century.
What this small band of merry climate scientists misses entirely is that in this time period we have had some horrendously unprecedented Cat 1 and Cat 2 storms: Ike, Irene and now Sandy. When climate scientists told us decades ago that hurricanes will become more powerful on a warmer planet, this is exactly what they meant. We will not just see more powerful Category 5 hurricanes; all hurricanes will have the capacity to become more powerful because of warmer ocean water. Yeah, maybe we will see the Saffir-Simmpson scale that currently only goes to Cat 5 have a new extreme Category 6 added, but there are other meanings of “hurricanes will become more powerful.”
Hurricane intensity is directly proportional to temperature. The higher the temperature, the greater the strength of any given hurricane or tropical weather system. This is a very basic piece of storm physics that is not disputed, yet the perceived debate continues as to whether or not hurricanes will become more extreme on a warmer planet.
This debate point is that Hurricanes have not become more intense yet, and it is valid globally but it is invalid in the Atlantic Basin. The Deniers and Delayers cite global research and ignore the Atlantic Basin where hurricane intensity has been proven to be increasing. It’s a very simple Conservative (capital “C”) ploy. The D&D gang can propel their agenda with valid climate science that completely ignores reality. The Pacific and Indian Oceans are very large compared to the Atlantic. Averaging the changes in hurricane strength there with the much smaller Atlantic means that the statistics come out telling us that globally, there is no statistically significant trend. But when the Atlantic basin is looked at singularly, and there is no reason why it should not be because Atlantic based storms are completely separate from Pacific and Indian Ocean based storms, the Atlantic shows a valid increase in strength.
The perceived controversy aside, what these good folks simply miss or choose not to discuss is that we are now having Cat 1 and Cat 2 storms with storm surges and storm coverage that dwarfs “normal’ storms in these categories. Ike was a 600 mile wide Cat 2 storm with a Cat 4 storm surge and $27.8 billion in damages, the third most costly storm in U.S. history until now, and it was just a Cat 2 storm.
Irene made landfall on Coney Island as a 65 mph tropical storm just thirteen months ago, but this 700 mile wide storm was ticketed with $15.8 billion in damages, and was the seventh most costly storm in U.S. history before Superstorm Sandy. Sandy was a Cat 1 with a Cat 3 storm surge and at an astounding 1,000 miles wide is projected to have caused between $20 and $50 billion in damages. On Halloween an Accuweather meteorologist went as far as saying the storm could top Katrina’s $108 billion. Katrina is a special case in that much of her damage was done inside the levee barrier of New Orleans. Any old Cat 3 storm would have broached these levees as Katrina did, but there is another side to the Katrina climate change connection. In Mississippi, on the powerful side of Katrina’s eye, an all-time U.S. record storm surge was set at 27.8 feet—with a Cat 3 storm, not a Cat 5. These kinds of records are almost always set by the most powerful storms—not the storms in the middle of the measurement scale.
This small and uncommonly vocal minority of weather and climate authorities telling us that climate change is not really to blame is loudly echoed by a very large and prosperous vested interest propaganda machine. Their story also includes reasoning that the increasing storm damage is caused by our rapidly increasing population. Maybe this is true in many places, but New Jersey’s population has only increased 16 percent in the last 32 years. New York’s population has only increased 16 percent since 1930! And Galveston’s population (where Ike hit) was no more during that landfall than it was in 1930!! Sure, damages were much more widespread, but the vast majority of the money is lost in relatively small areas near the epicenter of these events. This is easy to understand when we look at entire neighborhoods having to have trees removed and some roofs replaced vs. entire neighborhoods being completely wiped off the map. The costs between these two examples is several hundred times more (or greater) for the map wiping areas vs. the roof replacement areas.
I can’t explain why these supposedly learned individuals continue their attacks. A little deep thought (which I am certainly no master of) and some simple Googling replaces their “facts” with the truth in most cases. There are also more trustworthy ways to check the assumptions that extreme weather damages are increasing. All we have to do is read a few reports from the insurance people. Swiss Re and Munich Re, the world’s top two reinsurers, both tell us that weather disaster damages are increasing significantly and they say that the reason is not population.
The National Climatic Data Center also tells us that the number of inflation adjusted $1 billion or more weather events stayed relatively the same in the 1990s but has increased significantly since the turn of the century. Our 1990 to 2000 population grew 13 percent while the 2000 to 2010 population only grew ten percent. Why did a faster population growth result in relatively little increase in extreme weather event damages while a slower population growth since 2000 has seen extreme weather event damages soar?
It’s climate change plain and simple. When climate scientists tell us for decades that hurricanes will certainly be more powerful on a warmer planet, and we get these little storms making such big records—what in the world are we supposed to do, believe the D&Ders when they tell us it’s all maniacal climate change hand-wringing hysteria?
Absolutely not, and we need to tell our friends and neighbors and write the editors and station managers in the innocently unbiased broadcast media. What they are doing is trying to be fair the only way they know how by giving equal time to what they perceive as “both sides of the story.” What they are doing instead is giving air time to the viewpoint of a very small fraction of climate scientists who are supported by a very large propaganda industry. To the media, and most of the rest of us who are not climate geek inclined, it seems fair. The answer seems to be somewhere in the middle.
The authors of this paper, which by the way is titled “Evidence linking Arctic amplification to extreme weather in mid-latitudes,” conclude their research with not only a warning, but a statement that is quite contrary to what we hear so widely in the media about “not being able to link any one extreme weather event with climate change”:
Can the persistent weather conditions associated with recent severe events such as the snowy winters of 2009/2010 and 2010/2011 in the eastern U.S. and Europe, the historic drought and heat-wave in Texas during summer 2011, or record-breaking rains in the northeast U.S. of summer 2011 be attributed to enhanced high-latitude warming? Particular causes are difficult to implicate, but these sorts of occurrences are consistent with the analysis and mechanism presented in this study. As the Arctic sea-ice cover continues to disappear and the snow cover melts ever earlier over vast regions of Eurasia and North America, it is expected that large-scale circulation patterns throughout the northern hemisphere will become increasingly influenced by Arctic Amplification. Gradual warming of the globe may not be noticed by most, but everyone – either directly or indirectly – will be affected to some degree by changes in the frequency and intensity of extreme weather events as greenhouse gases continue to accumulate in the atmosphere.
And to be thorough, this paper was published before the great fire season in the West this year and failed to mention the fires in Texas associated with the drought of 2011. The Bastrop Complex Fire near Austin alone burned 1700 homes.
In summary, this is not what our climate changed weather will be like in the future. It will be worse, likely much worse, much faster than has been previously anticipated. The reason? We did not do as some of the smartest people in the world suggested prudent with our emissions nearly two decades ago. Our climate is now on the worst-case scenario as imagined by the Intergovernmental Panel on Climate Change and we have yet to act to reduce emissions. In 2010, even with the Great Recession fully suited out, emissions worldwide grew by a margin not seen in 40 years at nearly 6 percent. Don’t stop reading now however, even though the outlook is horrendously bleak.
Authoritative voices tell us climate change is not real, that it is a scientific conspiracy, that it is a natural cycle soon to end and that it will be good for society. These same confused voices, that are telling us all of these things at the same time; are also the voices that tell us that the solutions to climate change will ruin our economies… The vast majority of credentialed climate specialists say nothing of the sort. Richard Alley, Evan Pugh Professor of Geosciences at Penn State University, one of the lead authors of the 2001 and 2007 IPCC Reports, member of the United States National Academy of Sciences and one of the pivotal international researchers in climate science, tells us in his book Earth: the Operators’ Manual, about 100 reports have been published concerning the economic impacts of the solutions to climate change and they are focusing in on one thing.
The solutions to cleaning up climate pollution, using existing technologies, will cost about 1 percent of global gross domestic product (GDP) per year for 100 years. The astonishing thing to understand about this 1 percent of global GDP–this $540 billion a year—is that it is little different from what we have spent on our efforts to provide safe drinking water across the planet every year for the last 100 years. It is little different from what we spend on the U.S. military every year not counting wars, or what we spend on adverting every year across the planet. It is little different than the normal economic costs to our nation every year because of normal inclement weather—rain, snow, heat cold, wind, flooding and drought. It is more than four times less than what we spend every year in the United States alone relative to annual average 2000 to 2010 health care spending. And remember, this is using existing technologies. New technologies will significantly reduce or even change these costs into profits.
It’s only pollution. Please take a vocal stand. It will get worse before it gets better and the longer we wait, the more extreme these weather events will become. It will not be long before it personally impacts you or your loved ones. My turn was last year with the fires in Austin. I only hope my personal impacts will grow no worse. We have done so many things on this planet that can be said to be similar to fixing climate pollution. We can certainly control this beast if we act now and if we act strongly.
Afterthought
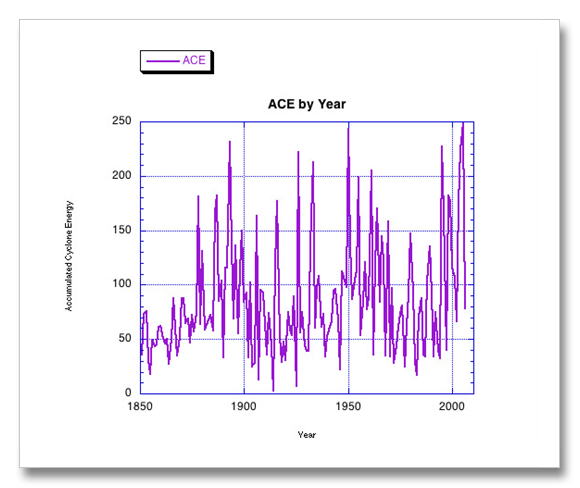
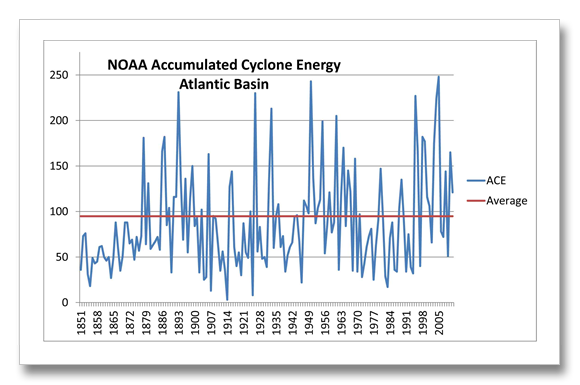
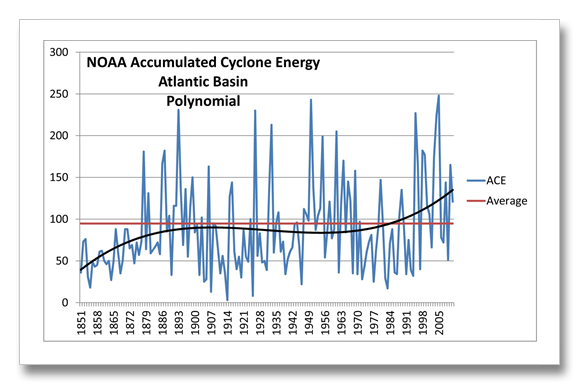
In response to comments from Wes on December 17 and January 7, I offer the following. Wes’s first post linked to NOAAs Accumulated Cyclone Energy graph. I thanked Wes for the link and remarked that this was an excellent example of the trend of hurricane strengthening trend in the Atlantic Basin. Wes however is a “skeptic.” His subsequent comment is below. Sometimes it is difficult to see trends in data graphs and I apologize if have assumed too much—I have been doing this sort of thing for some time now. Clues tell me what statistical analysis reveals. Here’s NOAAs ACE Graph:
Look at the area beneath the purple line and see how it seems larger, beginning somewhere in the 1990s, than anything else in the record, or look at the number of times the the maximum and minimums are high range of the historic maximums and minimums. And don’t forget that the ACE for 2012 has not been released yet. We had Sandy in 2012 which means two things. Sandy had a huge ACE, and we made it all the way to the “S” storms meaning that we had a lot of storms to help accumulate a high ACE for the year. If either of these techniques do not work for you then you will have to resort to statistical analysis, which is not that difficult if you can use Excel. I’ve done this for you below. The raw data comes from here: http://www.aoml.noaa.gov/hrd/tcfaq/E11.html
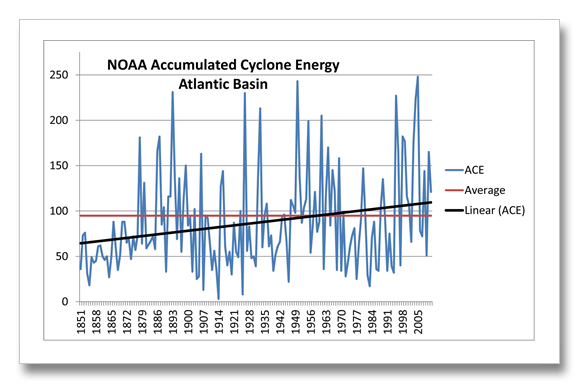
The red line is the average. Does it look like ACE is above average more since the mid 1990s than any of the high energy periods before the mid 1990s? No? How about a trend line. Below is a simple linear trend calculated by Excel’s statistical package:
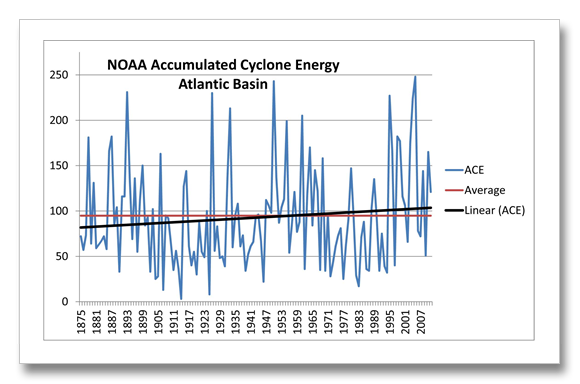
Maybe the first twenty five years of low ACE skews the trend? Because that was a long time ago, not that the end of the Little Ice Age had anything to do with it, I’ll scratch those years and recalc the linear trend:
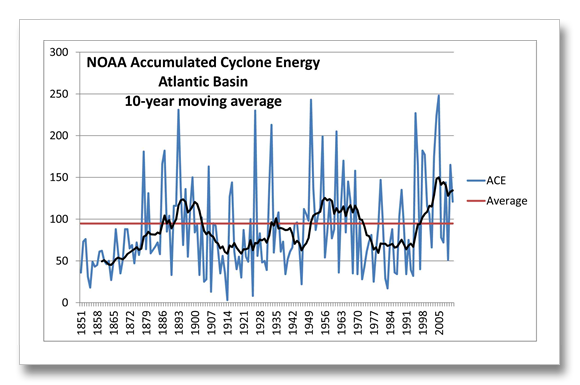
How about a ten-year running average?
Or a polynomial?
I have run out of buttons to click in the statistical package. Of course things may reverse themselves at any time now. This is a favorite thing for the deniers and delayers to remind us of. We have twenty years of this cycle and it’s about to end. But climate scientists have been projection for this to happen since the 1970s. The simple physics of what meteorologists call cyclogenisis tells us that warmer ocean waters create more powerful storms and we know that our oceans have indeed warmed steadily this century and most of the last. So what do we do? Believe the deniers and delayers and sit on our hands while those irreversible tipping points, that we have also been warned loom on our horizon, pass us by and sentence us all to a destiny beyond dangerous climate change?
Reference: Francis and Vavrus, Evidence linking Arctic Amplification to extreme weather in mid latitudes, Geophysical Research Letters, March 2012. http://www.agu.org/pubs/crossref/2012/2012GL051000.shtml

