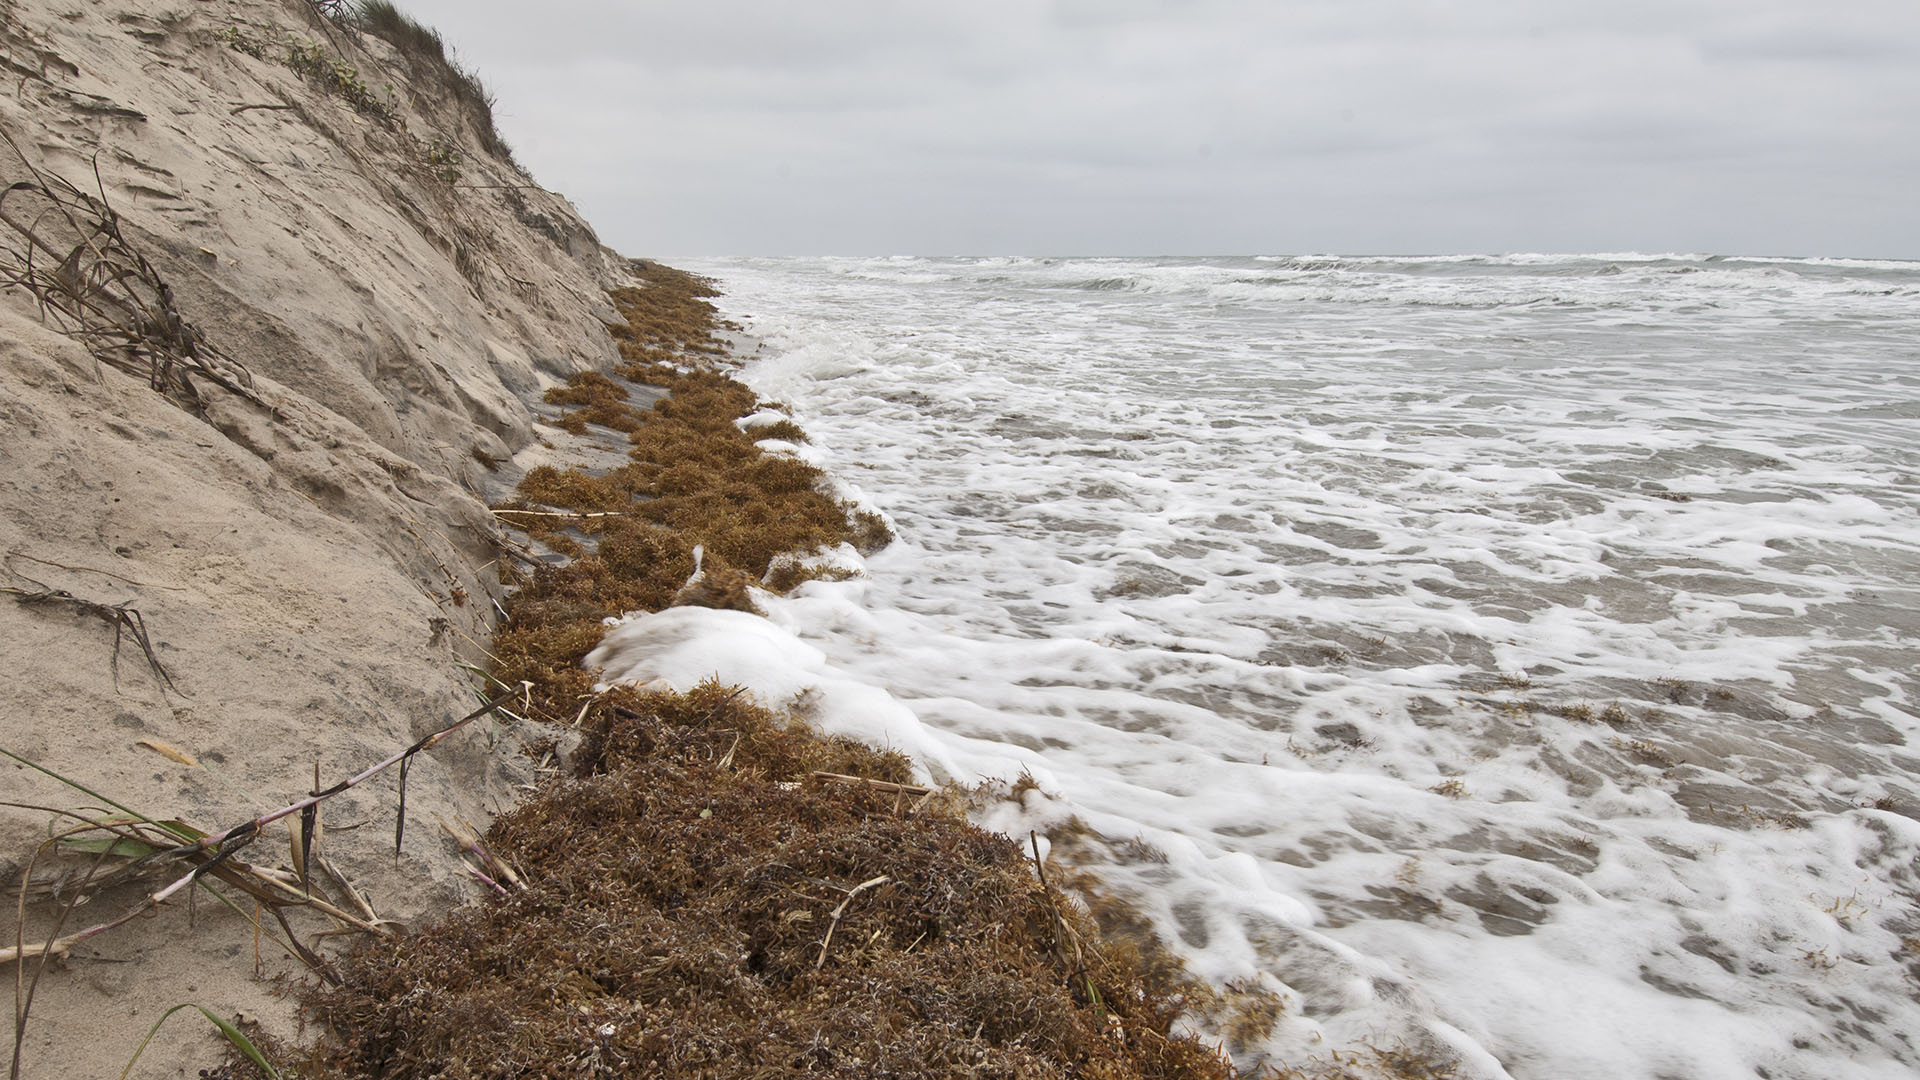
South Padre Island sea level rise erosion, mile 11 beyond end of pavement, Spring Tide, April 2014, non-storm conditions: Spring Tides in April and King Tides in October are the biggest tides of the year. They are caused by maximum tidal forces during the biggest solunar alignments of the year and show that it’s not the average sea level rise that is important, but the extremes. And today, the annual extremes have become large enough to create dune erosion during non-storm conditions with just a little bit of sea level rise. This is how barrier Island beach disintegration begins.
McClatchy reported on a new NOAA sea level rise impact report and made some very good points. But a lot of the true meaning is left out. I like to use well publicized journalism like this to be able to quickly get to the most important pieces of the science being reported on, that are invariable left out of media reports (and I believe this is largely because of word count constraints.)
“By 2070, the mid-range scenarios call for seas to be anywhere from 8 inches to 5.5 feet higher than today. By the turn of the century, NOAA projects the ocean could be as much as 10.5 feet higher…”
This is the top end of the worst-case scenario projection and is given a 0ne-percent chance of occurrence. There are two really important things that need to be understood about how this type of science is communicated that have fundamentally large impacts on meaning. The first is that sea level rise projections significantly ignore what they call dynamical change–basically ice sheet collapse–because it is not modelable. These newer projections are taking some excess ice loss from ice sheets into consideration, but not in a way that truly reflects prehistory. This is really dangerous considering that numerous lines have proclaimed the West Antarctic Ice Sheet is now collapsing with prehistoric collapse rates that are about 4 times higher than 10 feet per century.
The second thing is that FEMA requires properties to be protected by the National Flood Insurance Program be protected from the 100-year flood for their insurance to be issued. The 100-year flood is the flood that has a one-percent chance of occurring in any year. So, when hearing that an event has a very low sounding “one-percent chance of occurrence,” remember that FEMA flood insurance requires properties to be protected to the one-percent chance of occurrence flood. This is standard operating procedure for risk analysis that belies the apparent simplicity of the very low sounding one-percent chance of occurrence of 10.5 feet of sea level rise by 2100.
McClatchy goes on:
“Mid-range projections by NOAA scientists — not the worst-case scenario — put the seas around Florida up to 17 inches higher by 2030, with the highest rise at Mayport, Fernandina Beach and Daytona Beach.”
“With just a 9-inch rise in sea level, NOAA advisories for coastal flooding capable of causing ‘significant risks to life and property’ could occur 25 times more often.” This is very significant sounding on its own, but what exactly does it mean?
What this means is that the 5-year flood becomes the 2-month flood or a flood that we would expect to happen on average every five years will now happen every two months. It means that the 100-year flood will be expected to happen every 4 years. And remember, this is with just 9 inches of sea level rise. The way these earth systems work causes the increases to be exponential. In other words, a little bit of rise creates a very large amount of impacts. It’s not the average that is important, it is the extremes. Exactly how important is shown by the following:
The height of a given flood in any particular location varies, but the 5-year flood on average is just shy of 3 feet and it is expected to happen every two months by 2030 with a just 9″ sea level rise. The 100-year flood of 13 feet is basically what happens with a Cat 4 storm surge (13 to 18 feet), this flood is expected to happen every 4 years at any given location, on top of the 10 feet of sea level rise projected for 2100.
A report last month by the Union of Concerned Scientists that builds upon these NOAA projections has an even more detailed outlook, written in plain English:
Spanger-Siegfried et al., When Rising Seas Hit Home, Union of Concerned Scientists, July 2017.
http://www.ucsusa.org/sites/default/files/attach/2017/07/when-rising-seas-hit-home-full-report.pdf
From UCS’s Summary:
• Within 20 years, by 2035, nearly 170 coastal US communities
—roughly twice as many as today—will reach
or exceed the threshold for chronic inundation, given
moderate sea level rise.
• By the end of the century, given moderate sea level rise,
nearly 490 communities—including 40 percent of all East
and Gulf Coast oceanfront communities—will be chronically
inundated.
• Given more rapid sea level rise, nearly 670 coastal US
communities will face chronic inundation by the end of
the century. This number includes nearly 60 percent of
East and Gulf Coast oceanfront communities as well as a
small but growing number of West Coast communities.
Chronic Inundation — What this means…
Chronically inundated is the threshold used to determine when mass, permanent dislocation commences.What happens is that citizens, business and industry experiencing repeated flooding or stress from repeated flooding, can no longer cope with recovering from these repeated events so simply abandon their property and flee.
“Given more rapid sea level rise…” from the Union of Concerned Scientists report summary quoted above — These projections are based on +/- 10 feet of SLR by 2100. The ice sheet collapse scenario of near future modeling suggested by Margaret Davidson of NOAA in the Spring of 2016 is 10 feet by 2050-2060. Prehistoric evidence suggests sea level rise with a collapsing West Antarctic Ice Sheet of as much as 6.5 to 10 feet in 12 to 24 years (Blanchon 2009).
How Very Strong Negative Emissions Can Help:
By reducing the atmosphere’s temperature back to preindustrial times, we return our atmosphere to a stable period where snow and ice accumulation on Antarctica was about the same as underice melt and iceberg discharge. If we can then return upper ocean heat content around Antarctica to zero before collapse initiation completes, we can avoid abrupt sea level rise and the above flooding scenarios are moot.
Feldmann and Levermann, Collapse of the West Antarctic Ice Sheet after local destabilization of the Amundsen Basin, PNAS, November 17, 2015.
http://www.pnas.org/content/112/46/14191.full.pdf
How Can Ice Sheet Collapse Initiation Be Reversed? The following is my own conjecture, with no references that I know of yet, certainly no modelling (maybe when Margaret Davidson’s predication of ice sheet collapse modeling comes out:
Because most of the upper ocean warming has happened in the last 30 years and is the result of slow atmospheric warmth accumulation over a much longer period of time, upper ocean cooling should happen at a faster rate with abrupt atmospheric cooling than the rate it warmed with slow atmospheric warming. There is also a major positive feedback to ocean cooling: The upper oceans automatically bury heat as ocean currents sink into the abyss. This heat generally stays buried for centuries to 1,000 years before the cold abyssal waters resurface, bring abyssal cold with them. This relationship serves to speed up ocean cooling. These two things combined make it plausible that we can return upper ocean man-added heat content to zero or near zero in less than the 30 years that it took to create most of the warming, which will allow us to avoid West Antarctic Ice Sheet collapse as per Feldmann and Levermann 2015.