The UAH temperature record is touted by the D&D crowd as being proof that global temperature is not rising. This paper corrects some fundamental issues with the UAH dataset.
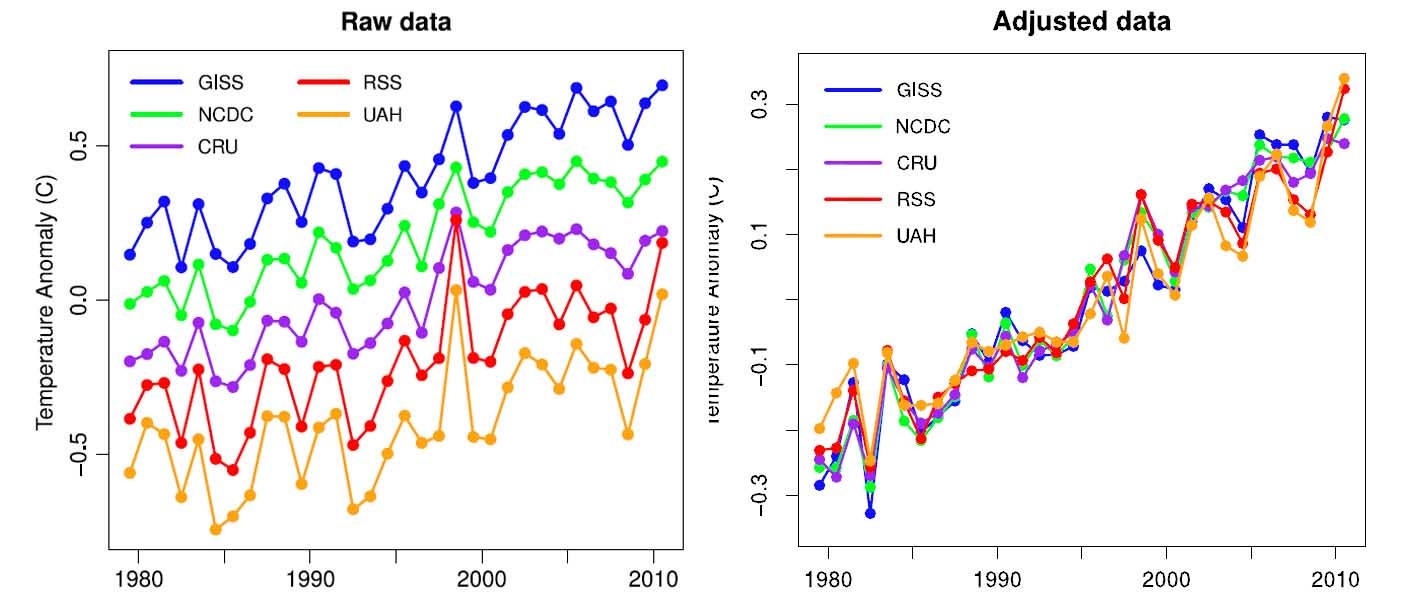
Here’s the latest scientific explanation of global temperature and why there is contention on how much it has warmed. The data below represents the consensus post IPCC 2007. The UAH data is the cherry picked data that folks like Rush Limbaugh and the Cato Institute refer to in their routine attempts at discreditation of climate science. In the raw data it is easy to see that the UAH data represents the least amount of warming and this is because of the way that the data is collected.
It does not mean that this data (or any of the other data) is wrong it simply means that it needs more correction than other data. And when I say correction, this is like taking your own body temperature after you have just been out for a brisk walk. Your temperature is elevated for reason after the walk. These reasons are what creates the difference between the UAH data and everybody else. Notice that other sources of data also show differences. The UK Meteorological Service for example does not consider Arctic temperature change in their work. They do this because there are no temperature reporting stations in the high Arctic. So they ignore this area of the globe and opt to not use other sources besides temperature recording stations to seek out this data. In reality, this area is warming faster than anywhere else as reported in ships records and various other reports of scientific and military efforts, including some satellite data. These sources of data are included in the NCDC and GISS temperature records.
The adjusted data graphic factors out sunspots, El Nino and volcanic aerosols. These are very well known factors that are well accepted in the literature but little known in the public realm.
Now a word about the deniers and delayers telling us this science is bunk because the data only look back to 1979. It is spurious for two reasons. One is that we do not have the robust data to go back further, the analysis could go back much farther but the most accurate and well accepted data begins with the satellite era. The argument that satellite data is wrong has been valid at times but the corrections have been made and those arguments are simply invalid today. From these satellite corrections even the previous satellite data has been corrected, yet the “Voices” don’t give a hoot what the subsequent academic evaluation of true skeptical arguments reveals. They just keep trotting out their dated and now invalid talking points. I urge you to read the paper and see for yourself. You are plenty smart enough to evaluate this kind of thing. A concerted effort has been made to communicate these findings in much more palatable language than previously used in academic work. This is quite common across all disciplines of climate science these days.
One more thing that is not represented here is the Asian Brown Cloud. This massive aerosol temperature mask has a significant cooling effect on Earth that is somewhere around 1.2 degrees F. It can be directly compared to the smog problem in the U.S. that developed after World War II and peaked in the 1970s. The creation of the Clean Air Act by President Nixon helped to vastly reduce the trouble we were having with smog then that had a very measureable impact that caused global temperature to stabilize for thirty years. The Asian Brown Cloud is directly related to the very rapid modernization of Asia in recent years. This modernization is the same kind of thing that happened in the U.S. after WWII, only much bigger. It is still relatively poorly understood, but a much better understanding is available today than just a few years ago. It is quite like that the IPCC will include significant discussion of this mask that approximately equals most of the warming that has happened on Earth since the industrial revolution.
Foster and Rhamstorf, Global temperature volution 1979-2010, Environmental Research Letters, 6, 2011. http://iopscience.iop.org/1748-9326/6/4/044022/pdf/1748-9326_6_4_044022.pdf