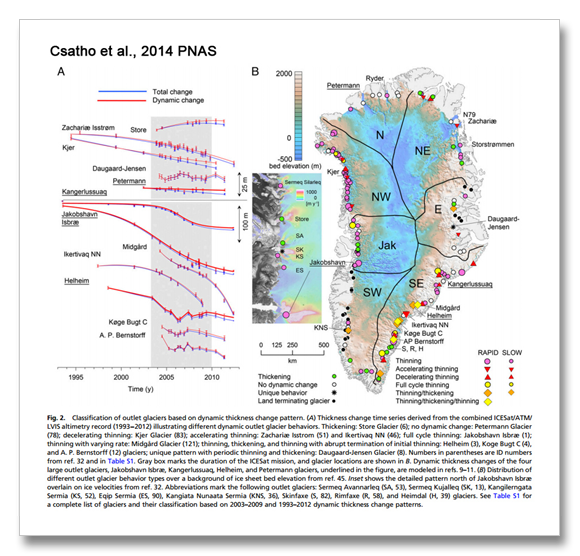
Greenland’s ice mass loss appears to be 22 percent more than 2013 IPCC suggests. The IPCC uses four major outlet glaciers to define Greenland ice mass loss. The most recent evaluation uses 130 glaciers and nearly 100,000 satellite laser altimetry points across Greenland.
This work was published in the Proceedings of the National Academy of Sciences by researchers at the University at Buffalo, University of Kansas, Utrecht University in the Netherlands, The Denmark Space Institute, and Florida Atlantic University.
(An interesting aside: The University of Kansas is home to the Center for Remote Sensing of Ice Sheets (CReSIS) and is a Science and Technology Center established by the National Science Foundation in 2005.)
Csatho et al. show an average of 243 gigatons (Gt) loss per year from melt, ablation (where ice evaporated directly skipping the water stage), and ice discharge for the total study period (1992 to 2012), and 263 Gt loss per year for the period 2005 – 2010. The IPCC shows 215 Gt loss per year.
The 2005 to 2010 loss of 263 Gt per year equals 0.73 mm per year of sea level rise. The interesting and important part of this research is that different glaciers behave differently and the IPCC’s choice of four likely does not capture a decent representation of Greenland’s ice behavior.
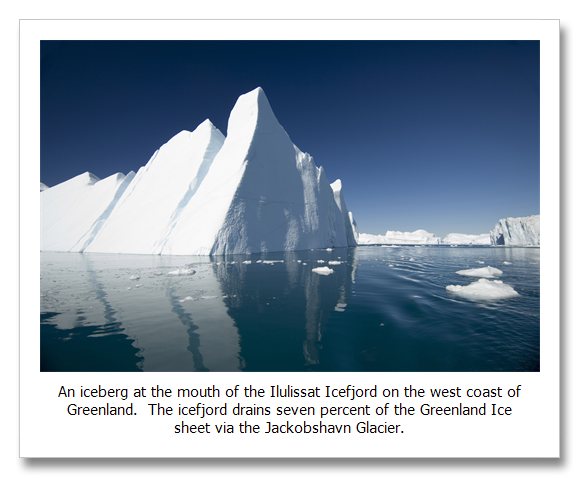
Some glaciers are influenced by summer melt on the ice sheet that drains to the bed and lubricates their flow to the ocean. Some are confined by what are called buttressing ice-tongues that act like a stopper in a bottle. Ice-tongues are disintegrating because their stability has been changed by warming ocean waters that circulate beneath the tongues. Some glaciers are influenced by changes in the configuration of the outlet fjord and good example is the Jakobshavn where the above image was taken.
The Jakobshavn was one of the fastest glaciers in Greenland for the last two decades, and it has been speeding up during most of this period because its buttressing ice-tongue was retreating due to warm ocean currents destabilized its ice-tongue. In 2014 however, the ice tongue retreated beyond the icefjord and into the ice sheet proper, behind a constriction in the bed of the fjord where bedrock rose from 4,000 to 5,000 feet below sea level to about 3,000 feet below sea level. Inland from this constriction, the fjord deepens to 5,000 feet, while the glacier extends down only to about 3,000 feet below sea level. This is allowing warm ocean water beneath the ice sheet proper and the Jakobshavn may be entering a new phase of acceleration. Read more here.
Outlet glaciers have these differing characteristics and the behavior of many of the glacier is dynamic—it changes. Csathro tells us that many of the glaciers in southwest Greenland have slowed in recent years. New increased melt, farther up the ice sheet, at first lubricated the beds of these glaciers causing them to speed up and thin. But now they appear to have come into equilibrium with the increased melt and have stabilized. Across the rest of Greenland however, most glaciers are increasing their speeds for one of the reasons listed above.
Of particular concern are the glaciers in north and northeast Greenland. These have ice-tunnels beneath them, similar to the over-deepened fjord of the Jakobshavn, that reach far beneath the ice sheet to a very large area that is below sea level. The bottoms of these tunnels are not ice choked and can convey warm sea water beneath the ice sheet proper. This conveyance works by convection. Water in contact with the ice cools and sinks, warm water flows in to replace it and the colder water is forced out by the warm water coming in.
Csatho et al., Laser altimetry reveals complex pattern of Greenland Ice Sheet dynamics, PNAS, December 30, 2014, abstract and paragraph 2, page 18480.
http://www.pnas.org/content/111/52/18478.full.pdf+html
Greenland ice loss IPCC… 2013 IPCC, Summary for Policy Makers, B3 Cryosphere, bullet 2.
http://www.ipcc.ch/pdf/assessment-report/ar5/wg1/WG1AR5_SPM_FINAL.pdf


