
The Devil’s Elbow: Just about as far as one can get from anywhere in Texas, this area is the big bend in the Texas coast on Padre Island, 35 miles of four-wheel drive beach from the end of pavement. It’s hard to imagine that this beach could disappear because of abrupt sea level rise, but it is after all, only sand.
James Hansen, 32 year director of the U.S. national climate modeling agency, the NASA Goddard Institute for Space Studies (1981-2013, now retired), has had a new fundamental piece of climate work published. His team looks at the negative emissions required–in addition to various scenarios for emissions reductions–that are needed to achieve “non-dangerous” warming. Under Hansen’s scenarios, to limit warming to 1.3 or 1.4 C maximum, and have the temperature fall back to about 1 C by the end of the century, we need to remove 7 to 32 gigatons of CO2 directly from the sky every year until 2100–in addition to 80 percent emissions reductions by 2050 and 100 percent by 2080. We emit nearly 40 Gt CO2 annually today.
Negative Emissions
Negative emissions are simply “extraction of CO2 from the air.” Negative emissions can take the form of many things like bioenergy with carbon capture and storage (BECCS), reducing emissions from deforestation and forest degradation REDD), agricultural techniques that improve soil health to increase carbon sequestration, direct air capture of CO2 with chemical and physical techniques, the manufacturing of raw resources from carbon from CO2 such as aggregates, hydrocarbon fuel, and carbon nanofibers, ocean fertilization to enhance productivity and increase the rate of carbon storage in our oceans, and even the farming of algae on land to produce fuel, food and fodder.
IMPORTANT — negative emissions are “in addition too” annual emissions reductions.
Dangerous Climate Change
In 1990 the rationale for the 2 degrees C warming limit was developed. This has been our limit to dangerous warming for nearly three decades now. When this limit was first defined, it was expected that we would begin immediate CO2 emissions reductions. But because of delay and the obvious increase of extreme weather events, it is now the one-degree C limit that is important. The research at the time that was developed to define exactly what dangerous warming is, says: “[Warming] beyond 1.0 °C may elicit rapid, unpredictable, and non-linear responses that could lead to extensive ecosystem damage.”
Counter to the way the 2 C limit has been used, the definition(s) of “dangerous warming” describe impacts of abrupt changes that are up to 100 time more extreme and 100 years faster than previously projected (see here.) the part of the definition that states: “…may elicit rapid, unpredictable and non-linear responses that could lead to extensive ecosystem damage” is not about the impacts we most commonly think about that we are experiencing today. (Harvey, Sandy, California drought and fires, Texas/Oklahoma drought, etc.)
Rapid, unpredictable and non-linear: The single instance extremes we are experiencing today are fragments of what makes up abrupt change. Take the recent California fires for example. These fires are but a small part of the increasing trend in wildfire across the U.S. and the world.

US wildfire season has increased by over 60 percent since the 1970s, from 138 days to 222 days, because of earlier onset of spring. The average burn time has increased nearly 800 percent, from 6 days to 52 days, because of deeper drying. Burned area increased an astonishing 12 times (1,271 percent). Human-caused ignition has played a very small role in increasing wildfire trends. Westerling, Increasing western US forest wildfire activity, sensitivity to changes in the timing of spring, Philosophical Transactions of the Royal Society B, May 23, 2016.
Abrupt change is not the slow, 100-year doubling or tripling of warming, or the doubling or tripling of impacts from extreme weather. The changes that happen abruptly are characterized by thousand-percent increases in trends of events across continental geographic regions or the entire world.
Burned area from wildfire in the American West has increased over 1,000 percent. The flooded area from Hurricane Harvey was 4,000 percent larger then previous records.
Ice scientists began warning us since 2008 that collapse of the West Antarctic Ice Sheet was underway. In prehistory when only natural forces were causing the collapse, sea level rose 10 to 20 feet per century for centuries on end. The current (2013) Intergovernmental Panel on Climate Change (IPCC) average projection of sea level rise is about 2 feet by 2100. Abrupt sea level rise from prehistory then, considering only natural forcing, is 1,000 percent more than what the IPCC estimates for our future.
Very importantly for the limits of dangerous climate change: abrupt changes are not included in IPCC work because they are not yet modelable to the extent required by the climate consensus. Prehistoric evidence is not considered because it is not verifiable in our current climate through modeling. This doesn’t mean it is not real, it means that our climate models are not yet sophisticated enough to figure it out.
So abrupt change is simply not a part of current climate consensus or the policy upon which it is based. But the dangerous limits to climate change were created based on abrupt changes. These limits were defined based on evidence from the past, when it was expected that we would begin emissions reductions immediately.
The reality of dangerous climate change then is that it is well underway with less than one degree C of warming. To stop these abrupt changes, we must reduce warming, and emissions reductions alone allow even more warming to occur. This is the pickle that Hansen describes that is easily seen in the graph below if one is visually afflicted with the ability to see this sort of thing:
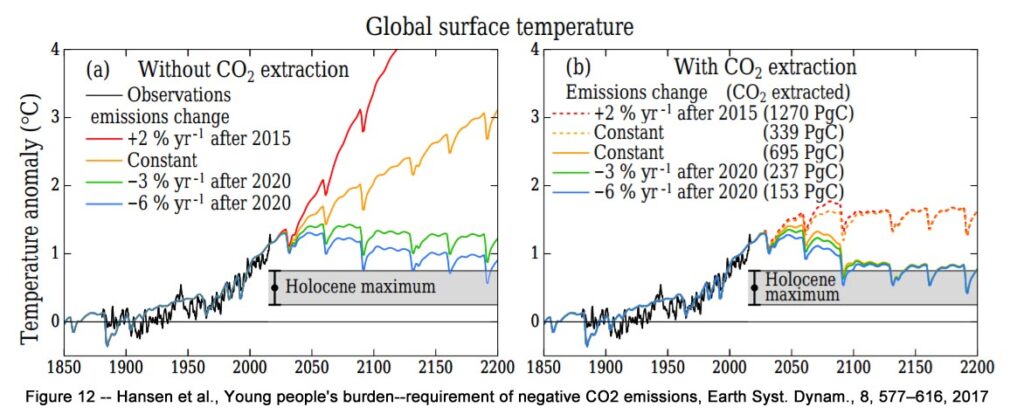
Look at the graph on the right “(b) With CO2 extraction.”
The five lines (orange, yellow, green and blue, solid and dotted) are scenarios ranging from top to bottom: business as usual with 2% annual emissions growth and very large negative emissions (orange dots), to 6% emissions reductions and much smaller negative emissions (blue line.)
PgC is Picograms carbon or the same as Gigatons carbon (Gt); 1 Gt carbon is equal to 3.667 Gt CO2.
1) (Top) … Orange dots — business as usual with 2% annual emissions growth and 4,660 Gt CO2 removal by 2100 (58 Gt average annually.) The temperature rises nearly another degree and stays there beyond 2200.
2) Yellow dots — constant emission, no change from today. 1,243 Gt CO2 removal by 2100 (16 Gt CO2 average annually.) The temperature rises nearly another degree and stays there beyond 2200.
3) Yellow line — constant emissions, no change from today. 2,550 Gt CO2 removal by 2100 (32 Gt average annually). The temperature falls back to where it is today by 2100.
4) Green line — 3% annual emissions reductions. 870 Gt CO2 removal by 2100 (11 Gt average Annually.) The temperature falls back to where it is today by 2100.
5) Blue line — 6% annual emissions reductions. 560 Gt CO2 removal by 2100 (7 Gt average annually.) The temperature falls back to where it is today by 2100.
Holocene Maximum — the gray shaded bar: this represents the maximum temperature achieved about 5,000 to 6,000 years ago that is about 0.3 to 0.7 C above the preindustrial earth temperature about 250 years ago.
Summary: The scenarios presented by Hansen achieve a stabilization of earth’s temperature at about what it is today at 1 degrees C or 350 ppm CO2 by 2100. Getting to 2100 though, the temperature overshoots, or increases until about mid-century before beginning to decline back to 1 C by 2100. This “overshoot” is additional warming in the pipeline because our climate is not at equilibrium. In other words, the oceans are still cooling our atmosphere.
Hansen’s three aggressive scenarios (yellow, green and blue lines) that appear as likely scenarios today with strong decarbonization already appearing because of reduced carbon intensity with fracked gas, and cheap solar and wind, include atmospheric carbon dioxide reduction of about 7 Gt (blue), 10 Gt (green), and 32 Gt (yellow) per year–in addition to the complete cessation of all fossil fuel emissions.
These large negative emissions, in addition to the complete cessation of all fossil fuel emissions, would still allow our temperature to almost double from the 0.69 C average global warming we had measured as of just 2014.
Because the abrupt change initiations we are seeing today have been building for years and even a decade or more with Antarctic collapse, we must assume then that even 0.69 degrees C of warming in 2014 is too warm.
The Good News
Hansen and his exceptional team have done some very good work that gives us more confidence that we are on the right track with very large negative emissions. But abrupt change is really what we need to be protecting against and to reverse abrupt changes already underway we must reverse warming back to safe levels far faster than by 2100. Because even Hansen’s large negative emissions scenarios allow warming that is double or more what has caused abrupt changes to trigger in the first place, we need further modeling to tell us what is the magic amount of negative emissions.
Because Hansen’s scenarios are nearly double annual emissions, it is quite plausible that double or more Hansen’s numbers are what can actually reduce warming by 2100. Remember, Hansen’s negative emissions of 7 to 32 Gt annually until 2100 allow overshoot to 1.3 or 1.4 C and then the temperature only falls back to today’s level by 2100. Under Hansen’s scenarios after 2100, it will take centuries or more for warming to be reduced back to zero.
Using nice round numbers then, a target of 50 to 100 or more Gt annual negative emissions on top of fossil fuel emissions reductions is what is needed to return warming to zero in time frames that matter and give us a chance of reversing abrupt change initiations.
Hansen et al., Final Paragraph: “There is no time to delay.” The recent delay in emissions reductions has caused required negative emissions to increase by a whopping 50 percent. Hansen goes on: “The difficulty of stabilizing climate was thus markedly increased by a delay in emission reductions of 8 years, from 2013 to 2021.”