In early May, after a late season cold front the temperature was a bit chillier than normal. We set four new record lows. It was the 10th coolest May in the record, yet it was only 0.9 degrees cooler than average. After the record lows we set two new record highs. At the same time,…
From the Catalan Institute of Climate Sciences, one of the largest scientific institutes in southern Europe, the French National Meteorological Service and the Catalan Institution for Research and Advanced Studies (Catalonia is basically one of the 17 states in Spain). The predominant part of the “global warming has stopped myth” is based on the concept…
The details of the temperature record are a lot more extreme than the National Weather Service averages reveal. Their current January average for Camp Mabry is 2.1 degrees above normal, but it’s nearly 5 degrees warmer than the 1980 average. Is this just the normal chaos of weather? The annual average Austin temperature has increased…

After twenty years of the D & D game climate change is much worse than it would have been if we had of started reducing emissions as the Kyoto Protocol, and nearly every single climate scientist on the planet suggested was prudent. First published on the Rag Blog, August 8, 2012. Before I tell you…

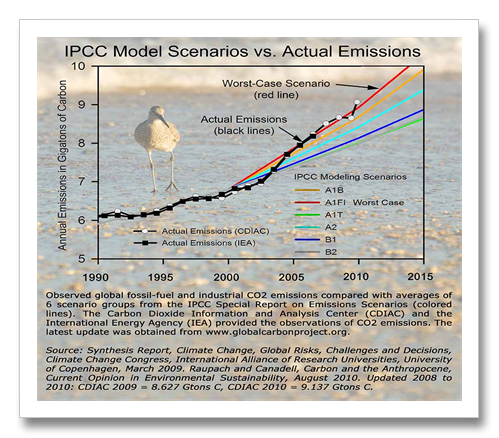
(This article is an expansion of and provides technical backup for Bruce Melton’s three-part series, “Welcome to Climate Change in Texas,” published in December 2011 and January 2012 on The Rag Blog.) Read More — Extra: Welcome to Climate Change Texas: The Worst-Case Scenario is Happening (expansion and backup) Part…

The UAH temperature record is touted by the D&D crowd as being proof that global temperature is not rising. This paper corrects some fundamental issues with the UAH dataset. Here’s the latest scientific explanation of global temperature and why there is contention on how much it has warmed. The data below represents the consensus post…

The Texas Forest Service tells us that a half billion trees have died. The first of this series of droughts in 2005/6 was just classified as extreme. The last two have been one category worse than extreme — the exceptional category. The last 12 months were drier than the worst 12 months of the great…

Environmental activist Bruce Melton discusses the real-world effects of climate change on Rag Radio with Thorne Dreyer. Listen to it here: http://theragblog.blogspot.com/2012/01/rag-radio-bruce-melton-on-real-world.html
The latest analysis of global temperature from GISs looks at the 12-month running average global temperature. Using the twelve month average smoothes out the chaos of monthly weather changes. The running average averages successive twelve month periods: March through February, April through March, May through April, etc. It’s a little different way of looking at…
Every ten years NOAA recalculates their average temperature. the average temperature is what we hear every night on television when the weathergirl says “the normal low temperature today was fourtysomething (or whatever).” NOAA, the parent organization of the National Weather Service, supplies these “normal temperatures. They are based on the average temperature for the high…

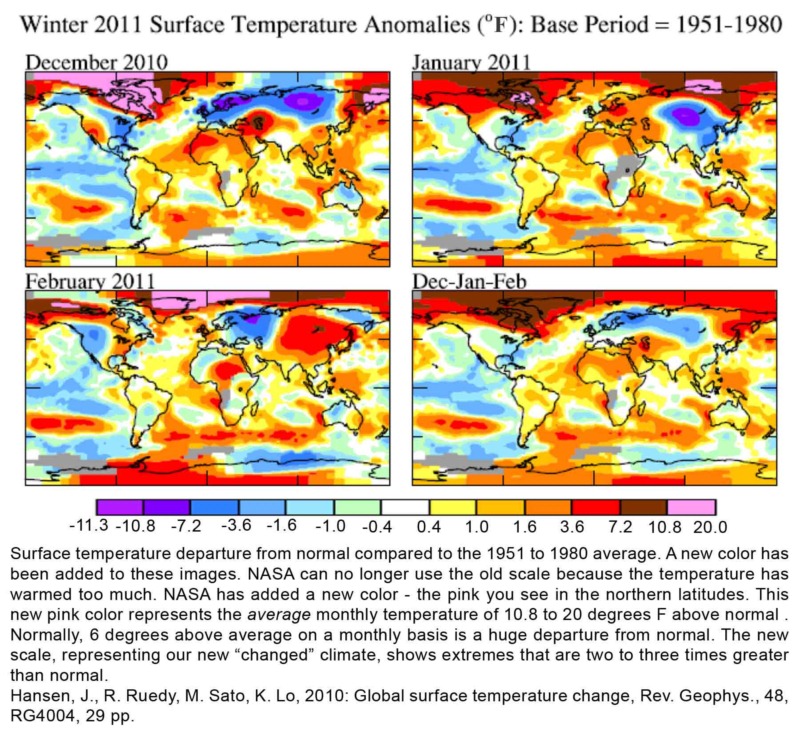
The earth warms and NASA quietly adds a new color to their legend to accommodate the change. No fanfare, no press release. The skeptical denialists did not even dispute the action. What does it mean? Think of your computer back in the 1990s. Remember how big that first upgrade to a 40 megabyte hard drive…

The yearly average global temperature last year beat out 2005 as the warmest ever by a few hundredths of a degree. The UK Met, The United Kingdom’s national weather service, tells a little different story, but not much. They had 2011 as the second warmest ever, just behind 1998. Why the difference? The Goddard Institute…
(Abstract) Results indicate statistically significant negative trends for melt onset and end dates as well as for the length of the melt season. On the average, over the past 30 years melt has been starting (finishing) ∼0.5 days/year (∼1 days/year) earlier and the length of the melting season is shortening by ∼0.6 days/year. Results indicate…
It has been 25 years and four months since the globally averaged monthly temperature was below the 20th century average. The last time the monthly temperature was below average was February 1985. NOAA National Climatic Data Center, Global June Analysis 2010
The period January through April 2010 was the hottest January through April ever recorded. The average ocean surface temperature for April was the warmest ever recorded. Arctic sea ice was below normal for the 11th consecutive April. Snow coverage in the Northern Hemisphere was below average for the seventh April in a row. The amount…
May 13, 2010 A wonderful weather record collected at a private resort 90 miles north of New York City over 114 years has surfaced in an article in the Journal of Applied Meteorology. The record is missing only 37 days. It has been handed down from generation to generation at a wilderness resort at a…
The U.S. Global Change Research Program (USGCRP) coordinates federal research on environmental changes and their implications for society. The program began as a presidential initiative in 1989 during the Reagan — Bush era and called for “a comprehensive and integrated United States research program that will assist the nation and the world in the understanding,…
Climate models are made out of all of these cells. The are typically about 10 km on edge (62 miles). Temperature analysis is done on a gridded basis. The scientists do not use the obviously heat modified temperatures of urban weather stations unadjusted. That would be unintelligent. The weather stations in each grid are all…
It never ceases to amaze me – the tenacity of the dedicated climate skeptics. Now they are leading a race to see how many people they can convince that climate change is not real because they say we are not setting a global temperature records every single year. They do not understand that the chaos…
Abstract: The current observed value of the ratio of daily record high maximum temperatures to record low minimum temperatures averaged across the U.S. is about two to one. This is because records that were declining uniformly earlier in the 20th century following a decay proportional to 1/n (n being the number of years since the…
