West Antarctic Ice Sheet Collapse: The Critical Path Article link Sea level rise estimates of around 10 feet by 2100 are now becoming hard to ignore. This article is about several new findings in 2018 that build on near-10 feet of sea level rise news from NOAA in 2016 and 2017. What is…
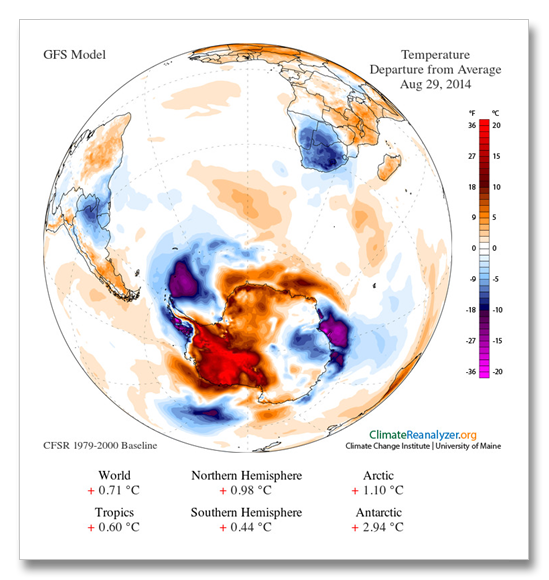
From the National Snow and Ice Date Center: “Air temperatures reached record high levels at two Antarctic stations last week, setting a new mark for the warmest conditions ever measured anywhere on the continent. On March 23, at Argentina’s base Marambio, a temperature of 17.4° Celsius (63.3° Fahrenheit) was reached, surpassing a previous record set…
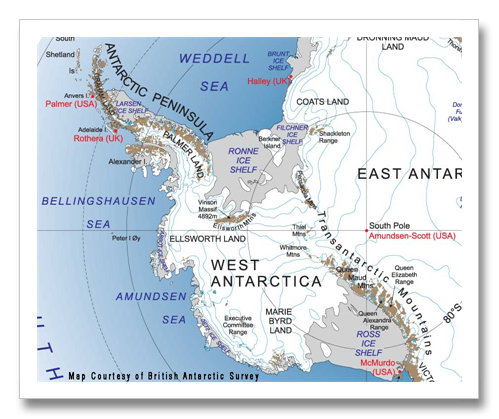
Researchers at UC Cal Irvine and NASA, using four different measurement techniques, have found that West Antarctica’s ice loss has tripled since 1992. The measurements looked at glaciers discharging to a west central location of West Antarctica called the Amundsen Sea Embayment (see Amundsen Sea in the map on the right). This could possibly be…
Recent reports of a record low ozone hole are everywhere. I cannot think of a word more appropriate for these reports except “bogus.” Some of the headlines say “lowest in 20 years” and some of the reporting makes this distinction, but do they tell you that before 1979 there was no ozone hole and today…
We have another mechanism conspiring to launch our planet into abrupt climate change. The Great Southern Ocean, or the Antarctic ocean is the culprit this time. Work out of the University of Zurich, Switzerland, Columbia University, Cambridge and Princeton has taken a million year look at sediment two sediment cores from the Antarctic. They found…
The most recent discoveries in climate science bear little resemblance to what we hear in the media. Greenland’s melt in 2012 for example has been widely advertised in the media as just another weather event, similar to many in the past. The adage that we cannot tell for sure if any single weather event was…
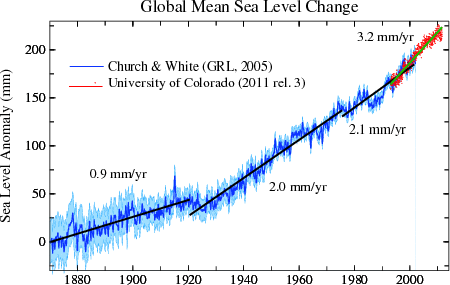
Over the years I have been watching the reports reporting how sea level rise slowly increasing. Slowly however is a misnomer. Sea level rise has rapidly increased since about 1990. The papers tell the story. Throughout most of the 20th century, sea level rise was between 1.2 and 1.5 mm per year. About 1990, it…
The National Snow and Ice Data Center has completed a big evaluation of the Larson Ice Shelf. You may remember the Larson B — it collapsed in 2002 in a colossal way. An area the size of Rhode Island collapsed in about 30 days. The collapse was caused by increased meltmater draining onto the crevasses…
Sounds good? More king crab is always good! Except when you are the vast southern oceans biologic community that has not seen claws or pinchers for forty million years. This development has been caused by a warming southern ocean, that is of course attached to the rest of the world’s oceans that are warming because…
February 1, 2011 – A paper by Stieg et. al. in 2009, widely accepted as the best in Antarctic temperature analysis in recent history, has recently come under fire from a paper by O’Donnell, et. al. O’Donnell’s paper says that warming in Antarctica is only half of what Stieg says. The denialists are wild with…
Antarctica is shrinking and the rate of melt and ice discharge is accelerating. In the last 20 years an area of ice almost the size of Alaska has been lost. Every ice front on the southern section of the peninsula has been retreating from 1947 to 2009, with the most dramatic changes since 1990.This U.S….
Institute of Theoretical Geophysics, Department of Applied Mathematics and Theoretical Physics, University of Cambridge, Wilberforce Road, Cambridge CB3 0WA, UK Abstract: Recent observations of the West Antarctic Ice Sheet document rapid changes in the mass balance of its component glaciers. These observations raise the question of whether changing climatic conditions have triggered a dynamical instability…
What was once widely regarded as being stable for at least the next century has already started to melt and at the least will contribute 4.5 feet to the IPCC sea level rise prediction. The 22 inches from the IPCC and additional melting identified as coming from Greenland put us up in the ten foot…
This mega effort by the US Geologic survey created a map of the Antarctic Peninsula Ice Shelves and their retreat during the study period. The report summary quotes "The map portrays one of the most rapidly changing areas on Earth, and the changes in the map area are widely regarded as among the most profound,…
The Wilkins ice shelf is 5,000 square miles of ice on the western side of the Antarctic Peninsula – an area large than the state of Connecticut. It started in February 2008 (the end of the Antarctic Summer). It continued through the Antarctic winter which was a big surprise to scientists. That sort of thing…
Wilkins Ice Sheet Collapses – The Size of Connecticut: Implications for the West Antarctic Ice Sheet
The disintegration of the largest ice shelf ever known to collapse started in February 2008 during the Antarctic summer. Signs of the breakup continued during the deep polar winter, something else that has never been seen before. The European Space Agency has now announced that the breakup amounts to 14,000 square kilometers, or over 5,000…